Fig. 10.
Download original image
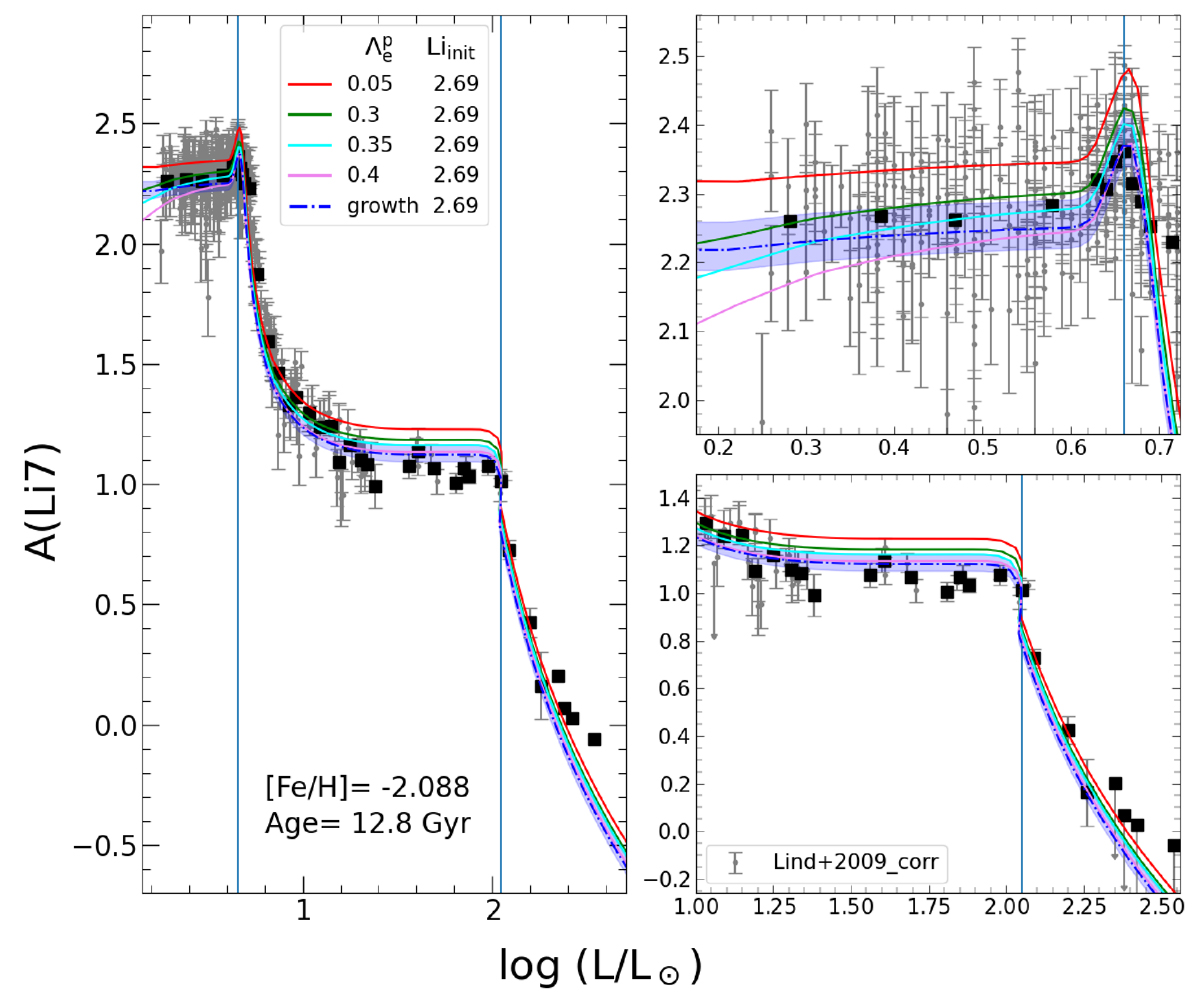
Variation in 7Li-abundance in average values (black squares) with our models of various overshooting efficiencies at the early evolution. The applied values of ![]() and initial A(Li7) are indicated in the label. The two panels on the right-hand side focus on the plateau (top-panel) and the RGB bump region (bottom-panel), with the re-derived 3D+NLTE data being shown in grey dots. The shaded area marks the uncertainty coming from the primordial lithium,
and initial A(Li7) are indicated in the label. The two panels on the right-hand side focus on the plateau (top-panel) and the RGB bump region (bottom-panel), with the re-derived 3D+NLTE data being shown in grey dots. The shaded area marks the uncertainty coming from the primordial lithium, ![]() of the “growth” model.
of the “growth” model.
Current usage metrics show cumulative count of Article Views (full-text article views including HTML views, PDF and ePub downloads, according to the available data) and Abstracts Views on Vision4Press platform.
Data correspond to usage on the plateform after 2015. The current usage metrics is available 48-96 hours after online publication and is updated daily on week days.
Initial download of the metrics may take a while.