Fig. 1.
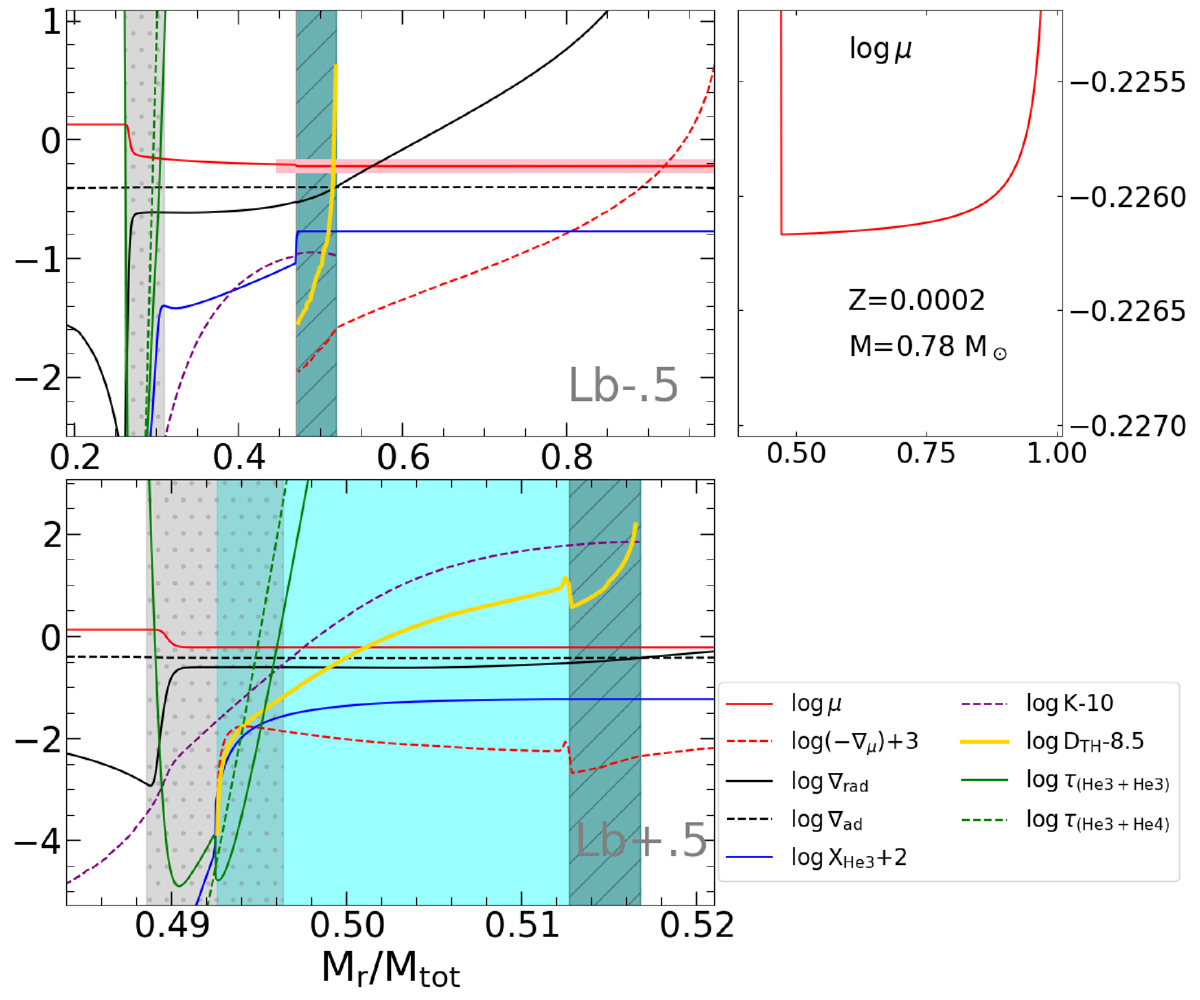
Download original image
Internal structure of the model with Z = 0.0002, M = 0.78 M⊙, Λe = 0.6, and αth = 50. Top-left and bottom-left panels are the illustrations at the ±0.5 dex point above and below the RGB-bump luminosity (Lb). The top-right panel is the zoom-in on the structure of log μ at the outer layers, which is marked by the pink band on the top-left panel. The cyan-shaded area indicates the thermohaline instability. The grey-hatched area indicates the envelope overshooting region. The grey-dotted area indicates the H-burning shell. The green lines are the decay timescale of different reactions (in 108 yrs).
Current usage metrics show cumulative count of Article Views (full-text article views including HTML views, PDF and ePub downloads, according to the available data) and Abstracts Views on Vision4Press platform.
Data correspond to usage on the plateform after 2015. The current usage metrics is available 48-96 hours after online publication and is updated daily on week days.
Initial download of the metrics may take a while.