Fig. 7.
Download original image
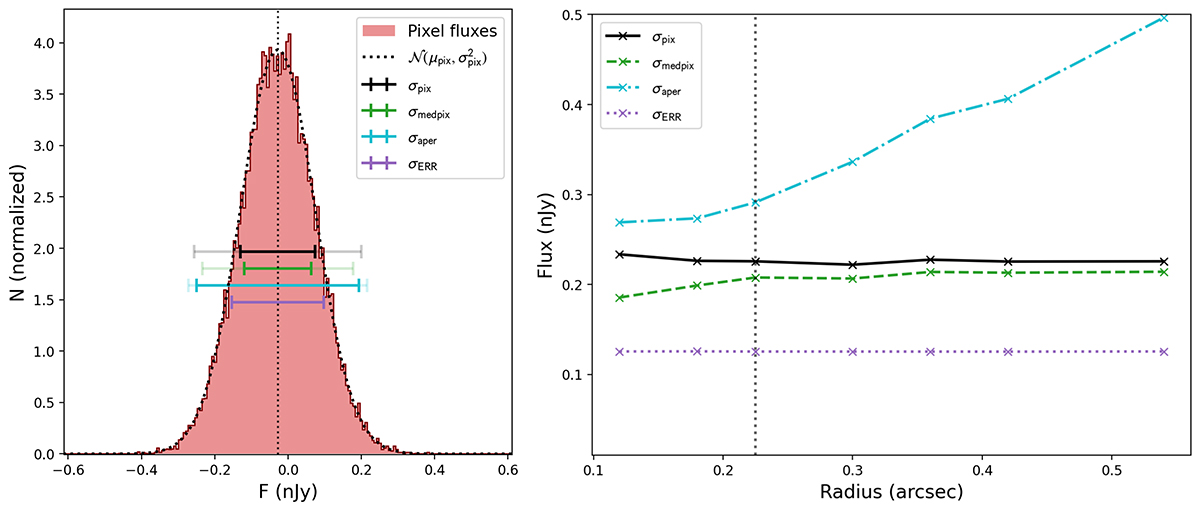
Left panel: Flux distribution of all pixels within the sky apertures (see text). The distribution closely follows a normal distribution, showcasing that our method of selecting sky apertures is robust. The black error bar shows the observed standard deviation of the distribution, and the other bars show different noise estimates. The shaded extensions to the bars show the effect of applying the drizzle correlation factor (R and Rap, for σmedpix, and σaper, respectively). Comparing the extended green bar to the extended cyan bar then give very similar results. The black bar, gives the total statistics for all the pixels contained within our apertures. The purple bar shows the noise as inferred from the image error extension (σERR). Right panel: The effect of aperture size on the noise estimates. We use an aperture radius of 0![]() 225 for the final noise estimate which is indicated by the vertical dashed black line. The noise estimates in this panel are all corrected for correlation (except for σERR).
225 for the final noise estimate which is indicated by the vertical dashed black line. The noise estimates in this panel are all corrected for correlation (except for σERR).
Current usage metrics show cumulative count of Article Views (full-text article views including HTML views, PDF and ePub downloads, according to the available data) and Abstracts Views on Vision4Press platform.
Data correspond to usage on the plateform after 2015. The current usage metrics is available 48-96 hours after online publication and is updated daily on week days.
Initial download of the metrics may take a while.