Fig. 5.
Download original image
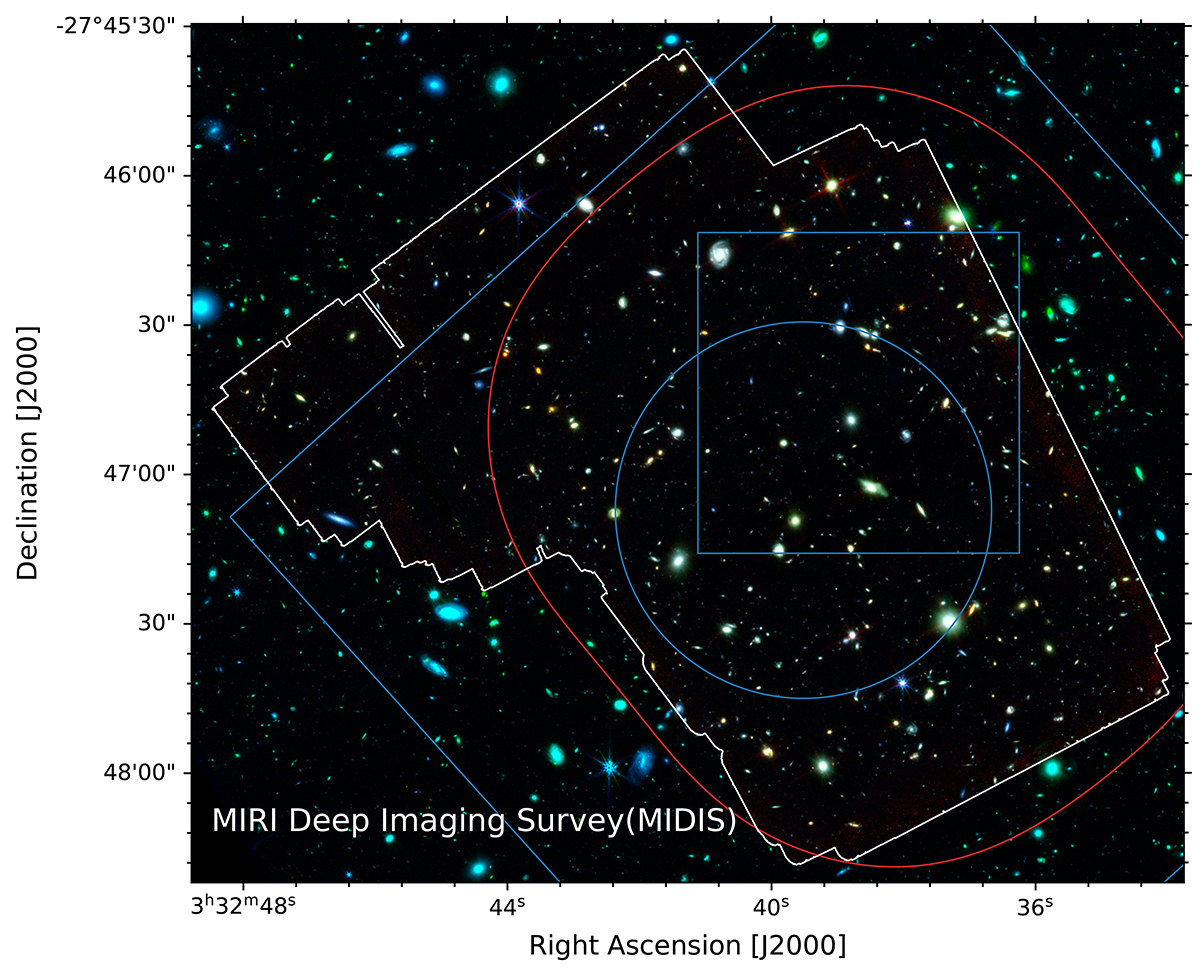
RGB composite of the MIDIS field, with its boundaries outlined by the white contours (the irregular shape of the field is due to the use of two different pointings/PAs and that the nominal FOV has an extra square at the top left where the Lyot coronograph is located). The F560W filter is shown in red, NIRCam F356W in green, and F150W in blue (the latter two from JADES, Rieke et al. 2023). We note that the sources outside the white contour appear blueish/greenish due to the lack of MIRI data there. The thin blue contours outline deep MUSE spectroscopic surveys at 10 h and 30 h (large and small squares) and the MUSE eXtreme Deep Field (MXDF, circle) reaching up to 140 h (Bacon et al. 2023), and the red contour outlines the extent of the deep ALMA data from ASPECS at 1.2 mm and 3 mm (see Boogaard et al. 2024 for details).
Current usage metrics show cumulative count of Article Views (full-text article views including HTML views, PDF and ePub downloads, according to the available data) and Abstracts Views on Vision4Press platform.
Data correspond to usage on the plateform after 2015. The current usage metrics is available 48-96 hours after online publication and is updated daily on week days.
Initial download of the metrics may take a while.