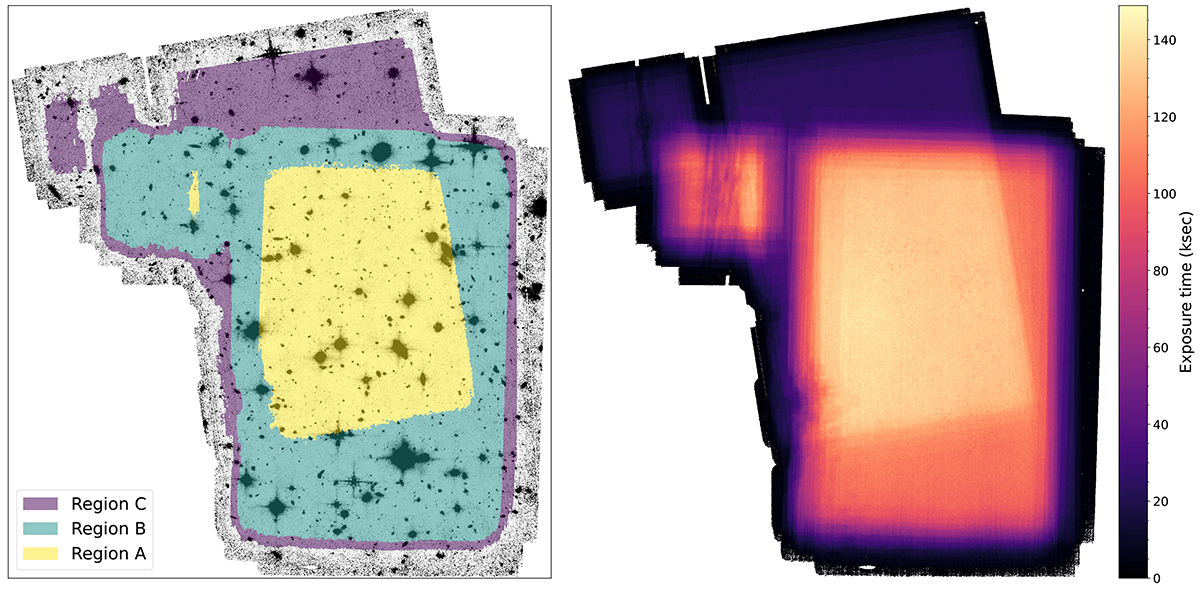
Fig. 4.
Download original image
Left: F560W image with linear intensity scaling. Coloured patches show regions with different depths where we have estimated the noise (see Table 1): the deepest area (A), where Obs 1–2, 4–6 overlap (yellow). The deep area (B), where Obs 4 does not overlap fully with the others (green). Outside these areas, there is coverage at less depth, notably the NE extension which only has observations from Obs 4. The area with at least 7h of combined integration is denoted C (purple). The orientation is in the detector plane (x,y). Right: Exposure time map.
Current usage metrics show cumulative count of Article Views (full-text article views including HTML views, PDF and ePub downloads, according to the available data) and Abstracts Views on Vision4Press platform.
Data correspond to usage on the plateform after 2015. The current usage metrics is available 48-96 hours after online publication and is updated daily on week days.
Initial download of the metrics may take a while.