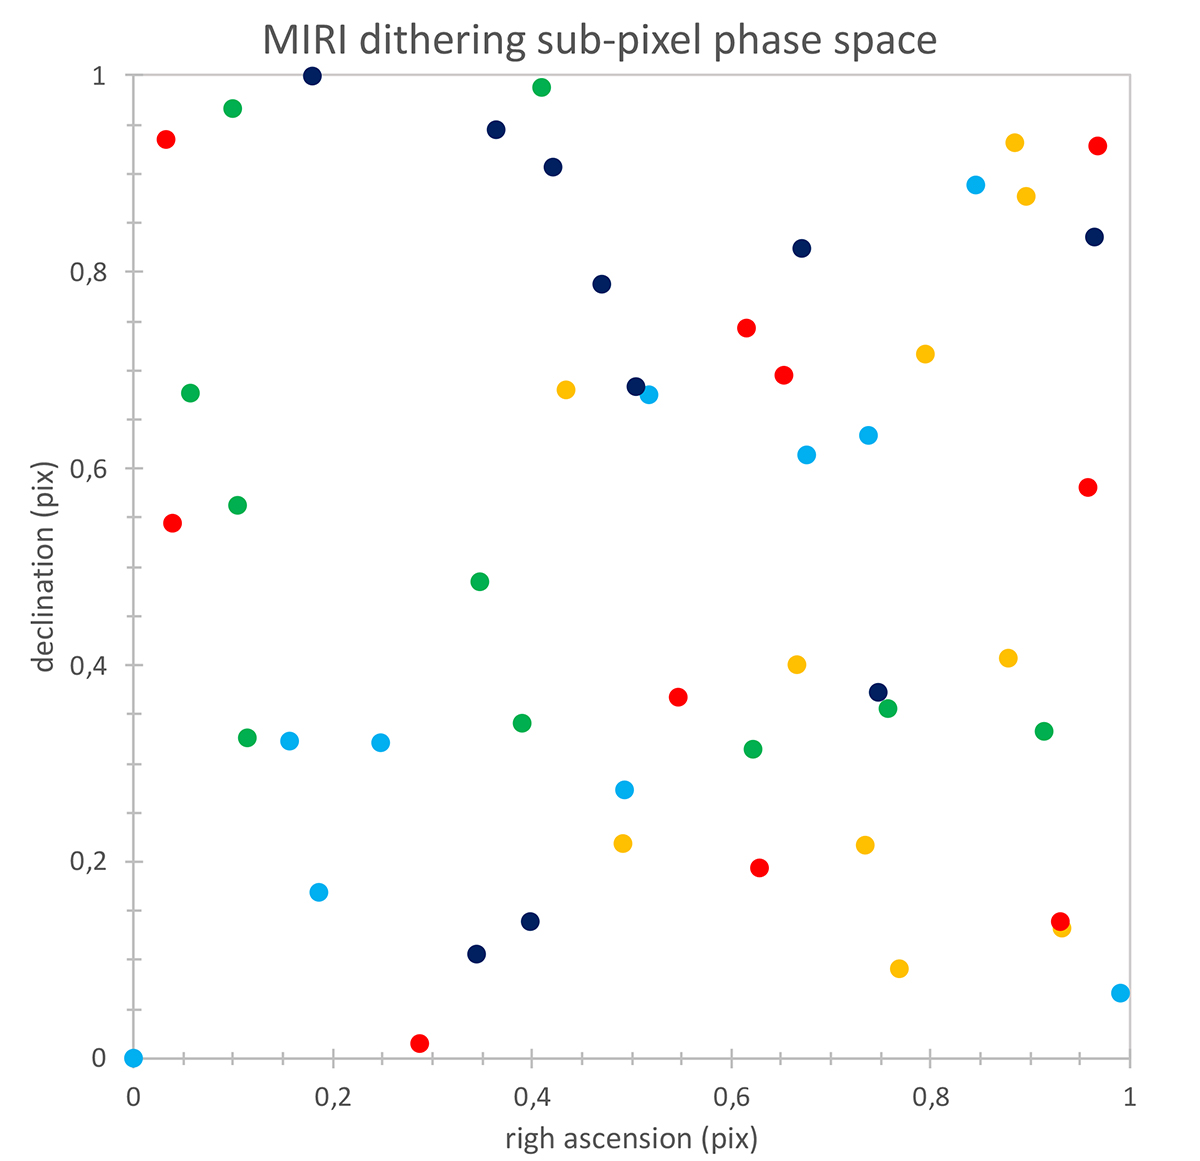
Fig. 2.
Download original image
MIRI imaging subpixel phase space sampling near detector centre, where the different colours refer to the different observations (1, 2, 4, 5, 6). The x axis shows |frac(xi − x1)| (i.e. the fractional pixel shift of the i’th dither position with respect to the 1st dither position in Obs 1) and the corresponding quantity on the y axis. The pixel scale for MIRI is 0.11″/pixel.
Current usage metrics show cumulative count of Article Views (full-text article views including HTML views, PDF and ePub downloads, according to the available data) and Abstracts Views on Vision4Press platform.
Data correspond to usage on the plateform after 2015. The current usage metrics is available 48-96 hours after online publication and is updated daily on week days.
Initial download of the metrics may take a while.