Open Access
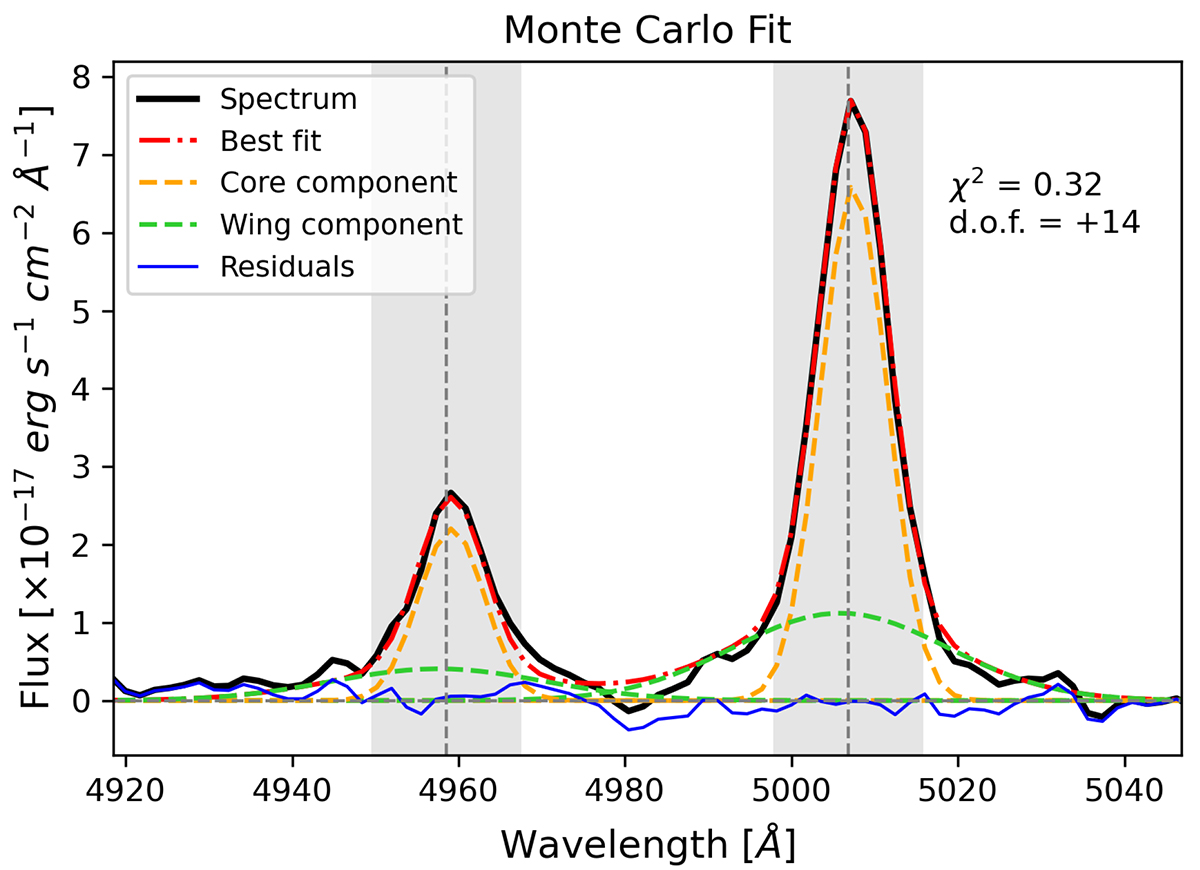
Fig. 1.
Download original image
[O III]λλ4959,5007 emission lines of J1641. The light gray shaded regions represent the ranges where the χ2 is assessed.
Current usage metrics show cumulative count of Article Views (full-text article views including HTML views, PDF and ePub downloads, according to the available data) and Abstracts Views on Vision4Press platform.
Data correspond to usage on the plateform after 2015. The current usage metrics is available 48-96 hours after online publication and is updated daily on week days.
Initial download of the metrics may take a while.