Fig. 6
Download original image
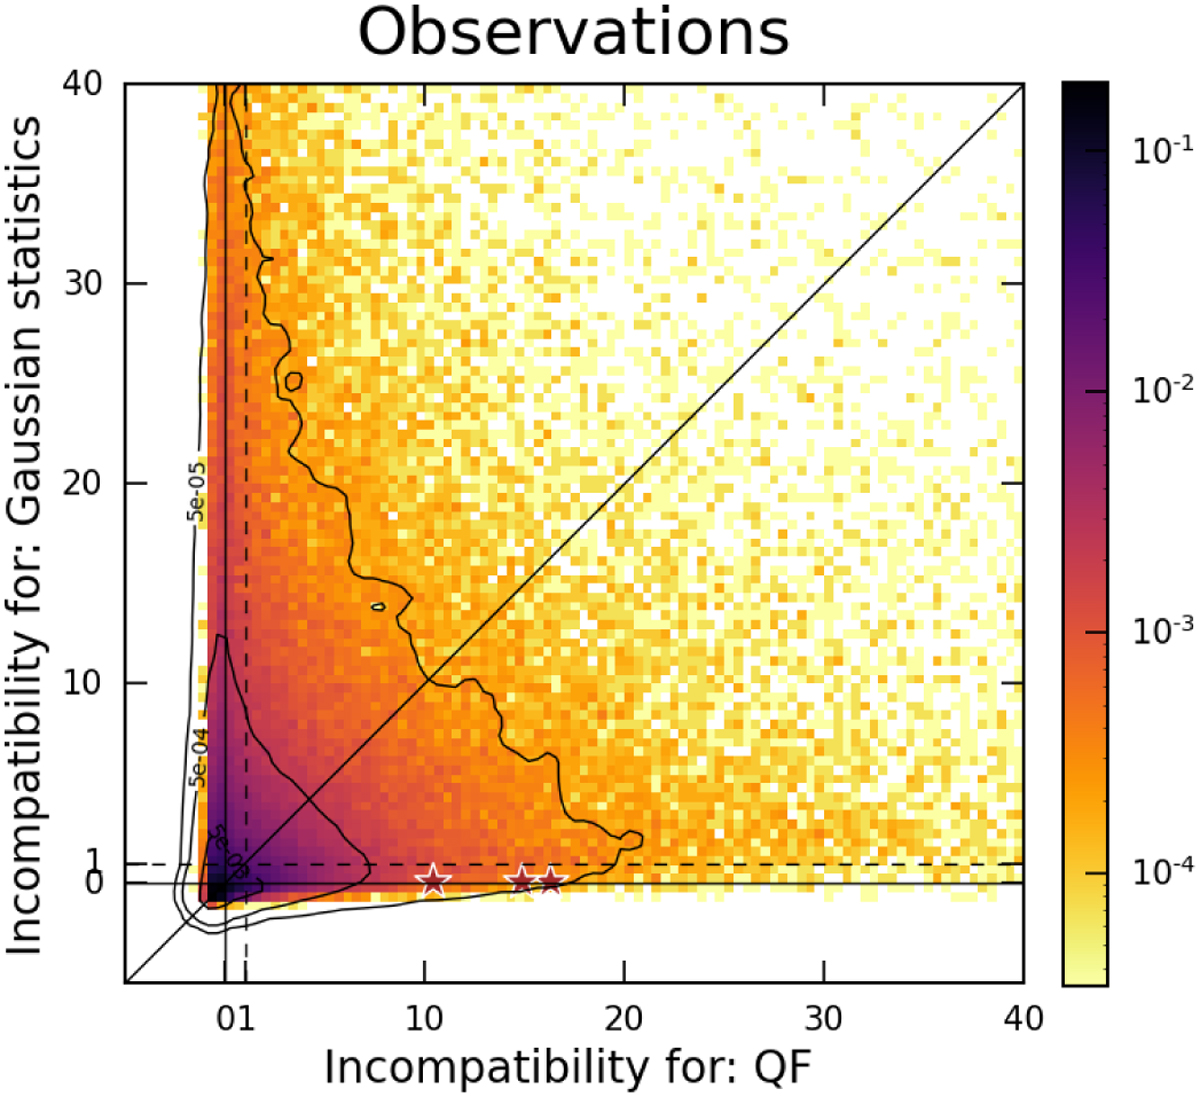
Confronting Gaussian statistics with QF statistics on observational data, based on the test presented in Fig. 5. Each set of statistics has strong degeneracies lifted by the other set. To investigate the Gaussian confusions, we pick three pairs of 512 × 512 patches, whose locations on the scatter plot are given by the red stars. These pairs are shown in Fig. 7.
Current usage metrics show cumulative count of Article Views (full-text article views including HTML views, PDF and ePub downloads, according to the available data) and Abstracts Views on Vision4Press platform.
Data correspond to usage on the plateform after 2015. The current usage metrics is available 48-96 hours after online publication and is updated daily on week days.
Initial download of the metrics may take a while.