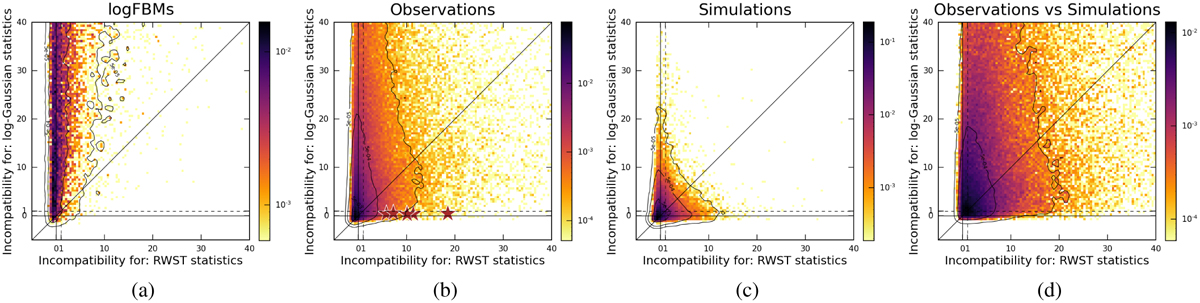
Fig. 10
Download original image
Confrontation of log-Gaussian statistics with RWST statistics on logFBM synthetic data (a), observations (b), simulations (c), and observation-simulation pairs (d). As expected, no log-Gaussian degeneracies are found for the logFBM data (a). However, some are found for the other cases (b,c,d). To investigate the log-Gaussian degeneracies in the observations, six pairs of patches, whose locations on the scatter plot (b) are given by the red stars, are shown in Fig. E.1. Only five stars are actually visible, but two of them are overlapped at the horizontal coordinate x = 10.
Current usage metrics show cumulative count of Article Views (full-text article views including HTML views, PDF and ePub downloads, according to the available data) and Abstracts Views on Vision4Press platform.
Data correspond to usage on the plateform after 2015. The current usage metrics is available 48-96 hours after online publication and is updated daily on week days.
Initial download of the metrics may take a while.