Fig. 5.
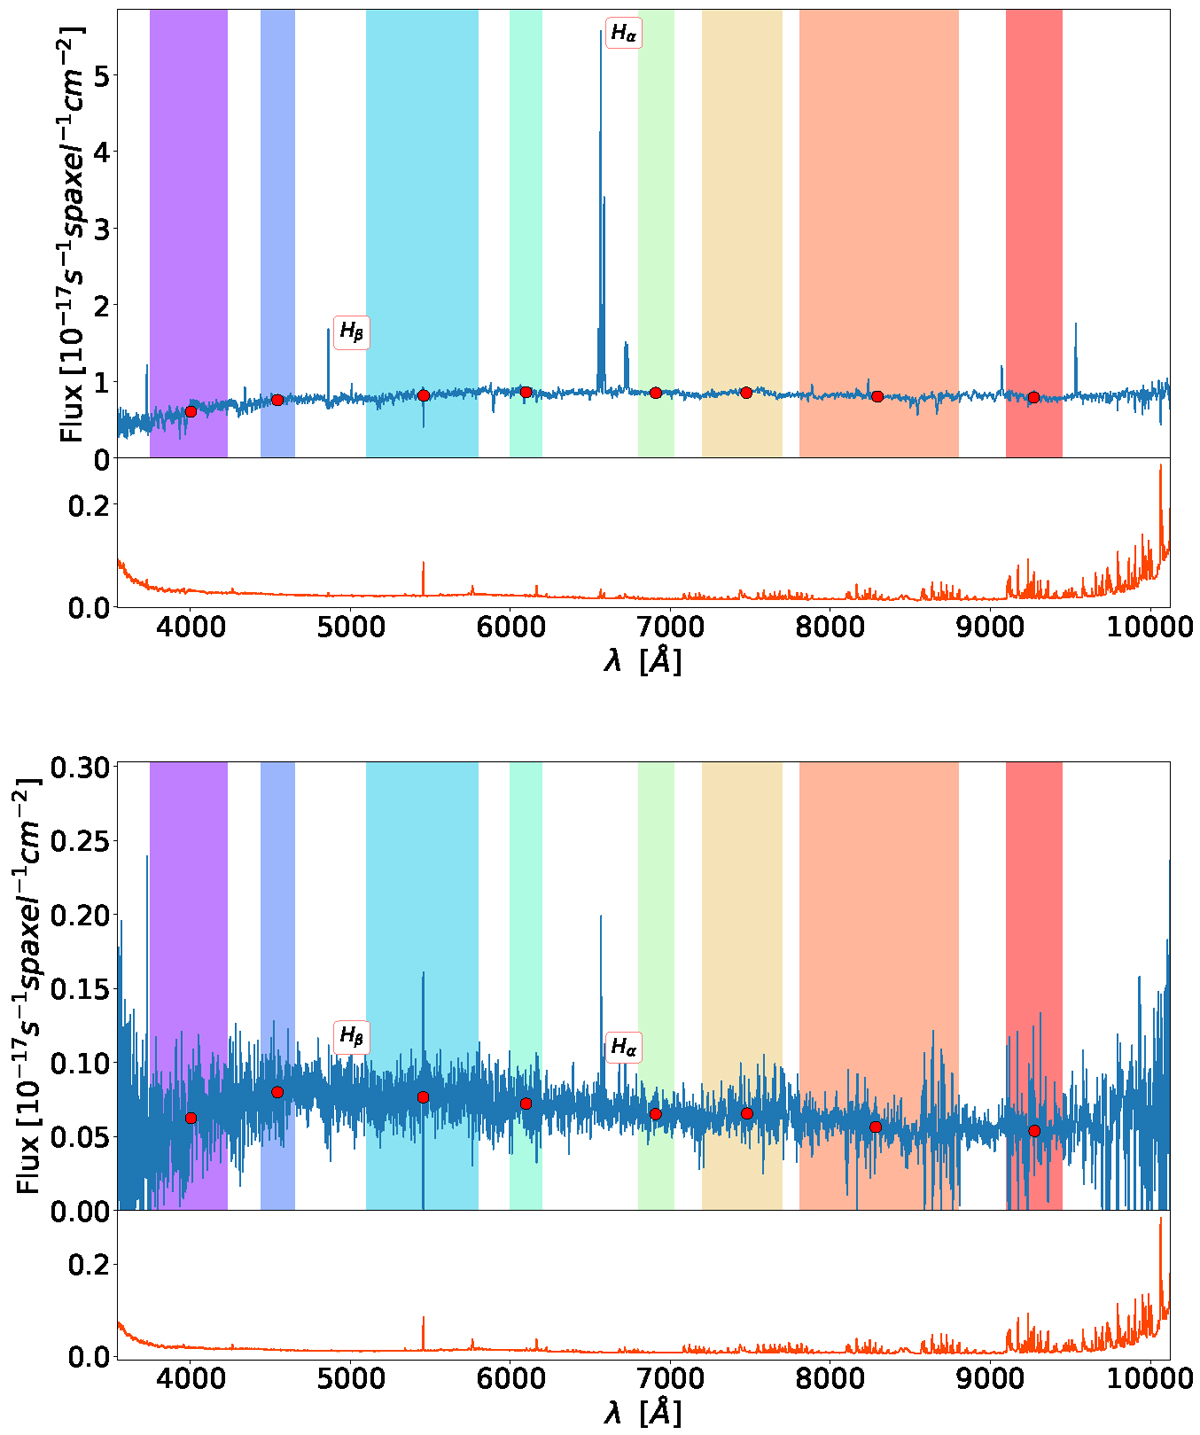
Download original image
Custom filters over a high and low S/N MaNGA spectra. We show the spectra in two different spaxels for the MaNGA galaxy 12483-12704, one with high S/N (upper panel) and another with low S/N (lower panel) selected from the MaNGA DAP datacube, for comparison. In both panels, the spectra are represented by solid blue lines that cover the full range of the MaNGA spectra, from 3600 to 10 000 Å. The corresponding error is represented by an orange line in the sub-panels. Colour regions show the custom filter wavelength range, with purple, blue, light blue, cyan, green, yellow, orange, and red corresponding to the M3992, M4542, M5446, N6097, N6908, O7473, O8281, and O9265 filters, respectively. The central wavelength that corresponds to each filter is represented by red circles.
Current usage metrics show cumulative count of Article Views (full-text article views including HTML views, PDF and ePub downloads, according to the available data) and Abstracts Views on Vision4Press platform.
Data correspond to usage on the plateform after 2015. The current usage metrics is available 48-96 hours after online publication and is updated daily on week days.
Initial download of the metrics may take a while.