Fig. 2.
Download original image
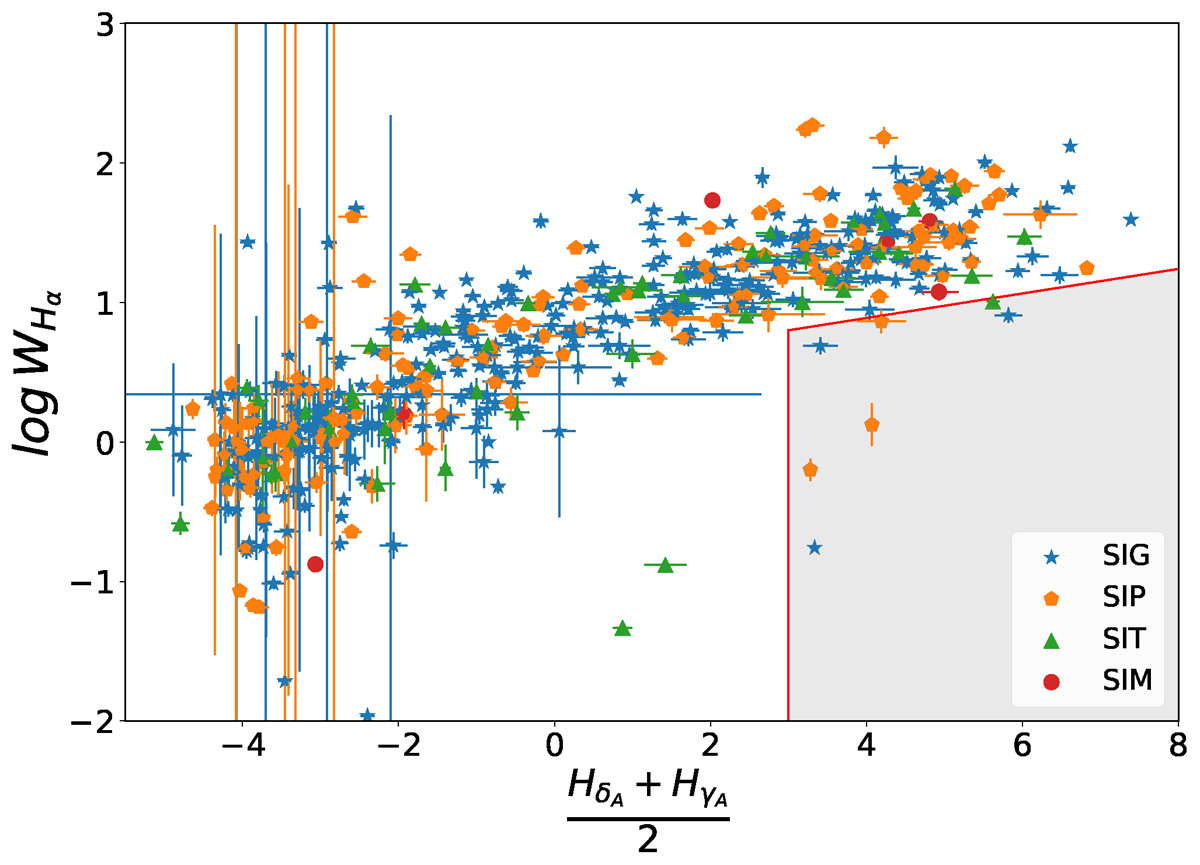
Post-starburst diagnostic diagram (spectral index distributions Hα equivalent width vs. ![]() ) for SIG, SIP, SIT, and SIM galaxies with MaNGA data considering the spectra associated to the central spaxel, and their associated error bars. The values for galaxies in each sample are presented with symbols and colours according to the legend. The red solid line and area indicate the PSB region.
) for SIG, SIP, SIT, and SIM galaxies with MaNGA data considering the spectra associated to the central spaxel, and their associated error bars. The values for galaxies in each sample are presented with symbols and colours according to the legend. The red solid line and area indicate the PSB region.
Current usage metrics show cumulative count of Article Views (full-text article views including HTML views, PDF and ePub downloads, according to the available data) and Abstracts Views on Vision4Press platform.
Data correspond to usage on the plateform after 2015. The current usage metrics is available 48-96 hours after online publication and is updated daily on week days.
Initial download of the metrics may take a while.