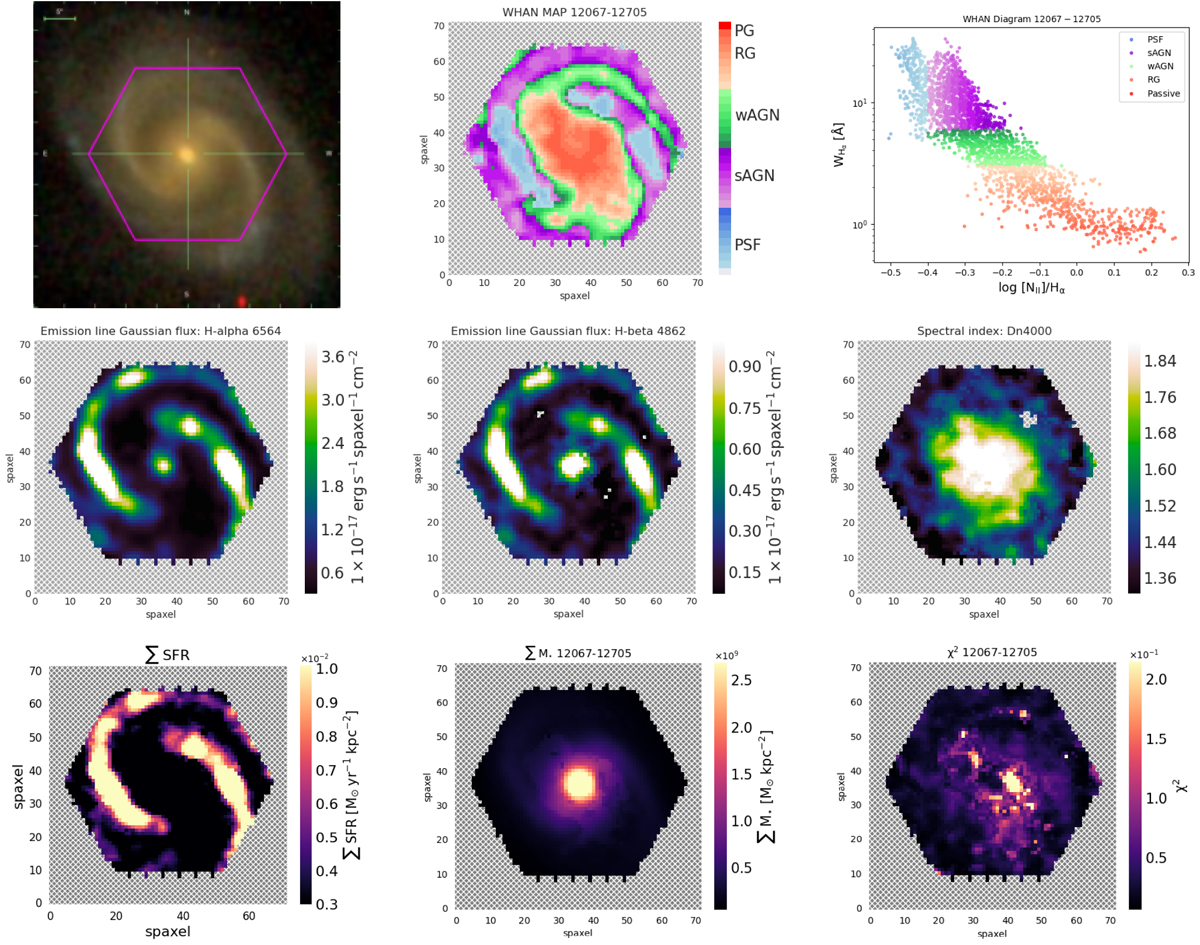
Fig. A.1.
Download original image
Analysis maps for the CP galaxy 12067-12705. From left upper to right lower panels: SDSS colour image with the MaNGA FoV, WHAN diagnostic diagram map, WHAN diagnostic diagram scatter plot, Hα emission line map, Hβ emission line map, spectral index Dn4000 map, SFR CIGALE result map, M⋆ CIGALE result map, and χ2 CIGALE result map.
Current usage metrics show cumulative count of Article Views (full-text article views including HTML views, PDF and ePub downloads, according to the available data) and Abstracts Views on Vision4Press platform.
Data correspond to usage on the plateform after 2015. The current usage metrics is available 48-96 hours after online publication and is updated daily on week days.
Initial download of the metrics may take a while.