Fig. 17.
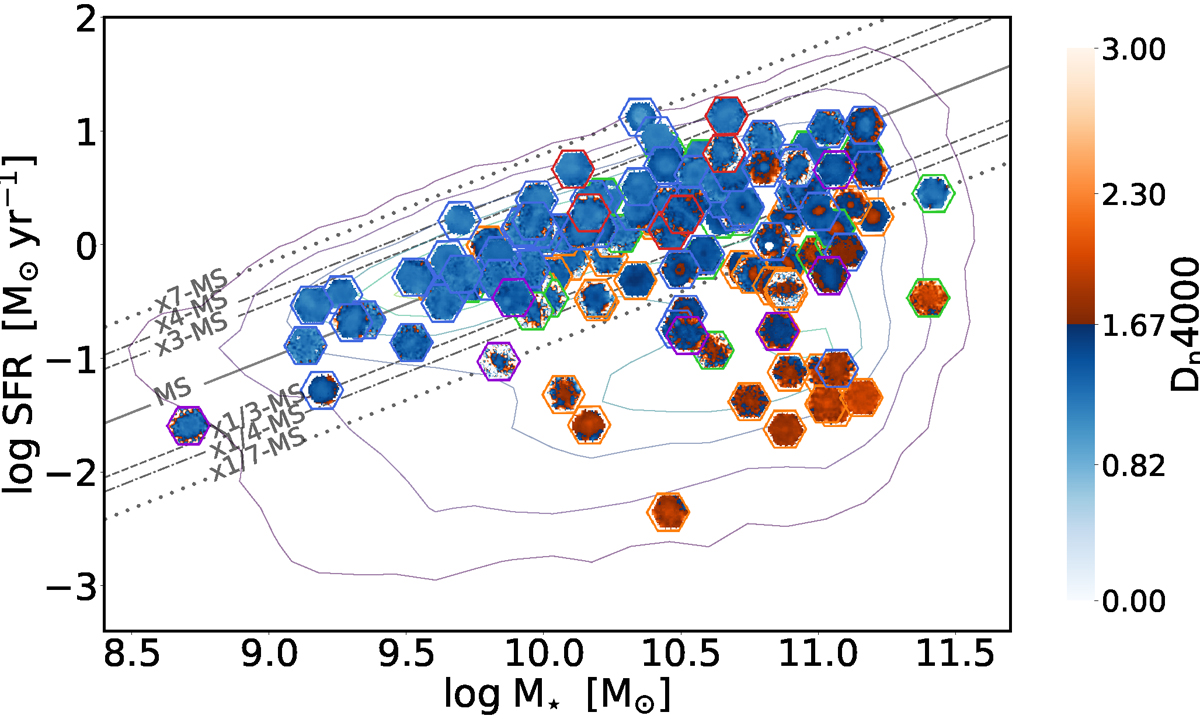
Download original image
Integrated SFR − M⋆ diagram for the 137 galaxies in the sample as in Fig. 16, but using maps of the age of the stellar populations instead of WHAN maps. The maps are divided into young blue degraded colour (for spaxels with Dn(4000) ≤ 1.67) and old orange degraded colour (for spaxels with Dn(4000) > 1.67) according to their Dn4000 parameter, respectively for each galaxy.
Current usage metrics show cumulative count of Article Views (full-text article views including HTML views, PDF and ePub downloads, according to the available data) and Abstracts Views on Vision4Press platform.
Data correspond to usage on the plateform after 2015. The current usage metrics is available 48-96 hours after online publication and is updated daily on week days.
Initial download of the metrics may take a while.