Fig. 16.
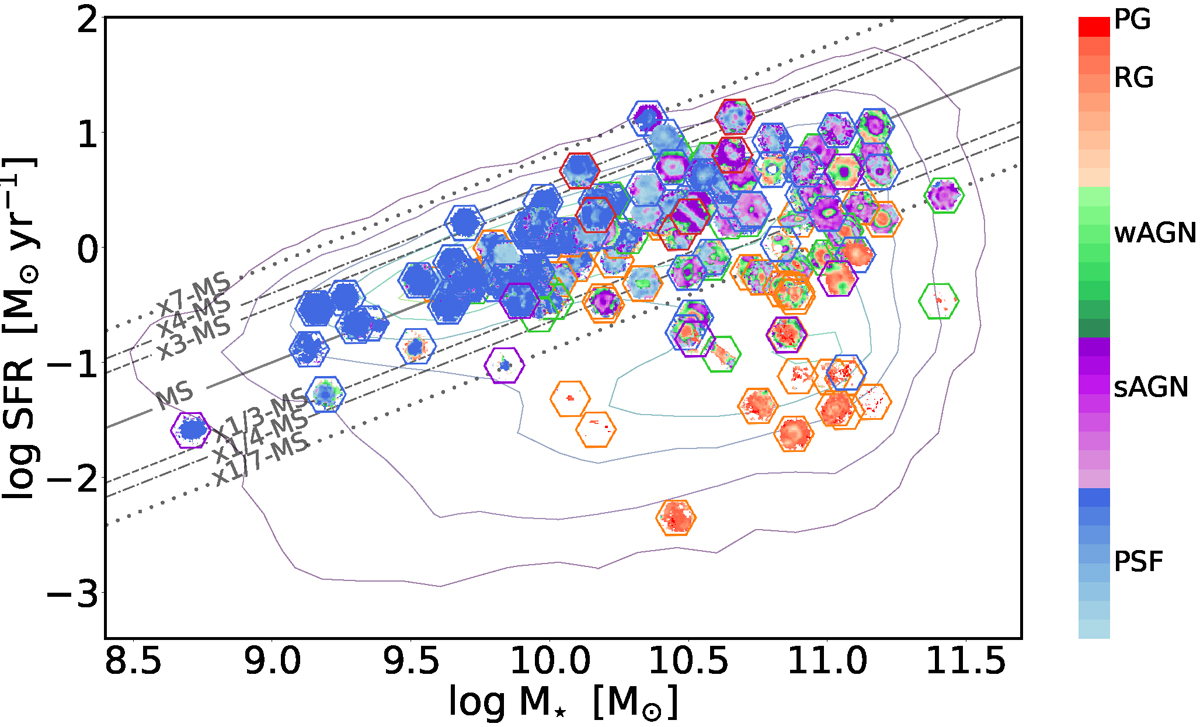
Download original image
Integrated SFR − M⋆ diagram for the 137 galaxies in the sample as in Fig. 13, with the point values as WHAN maps respectively for each galaxy. The colourbar represents the WHAN categories based on Cid Fernandes et al. (2011). The coloured hexagons indicate the merger stage for each galaxy in the diagram following the colour scheme in Fig. 13. The dashed lines mark the locations with three, four, and seven times above the main sequence (along the SFR axis), and 1/3, 1/4, and 1/7 times below the main sequence, respectively.
Current usage metrics show cumulative count of Article Views (full-text article views including HTML views, PDF and ePub downloads, according to the available data) and Abstracts Views on Vision4Press platform.
Data correspond to usage on the plateform after 2015. The current usage metrics is available 48-96 hours after online publication and is updated daily on week days.
Initial download of the metrics may take a while.