Fig. 15.
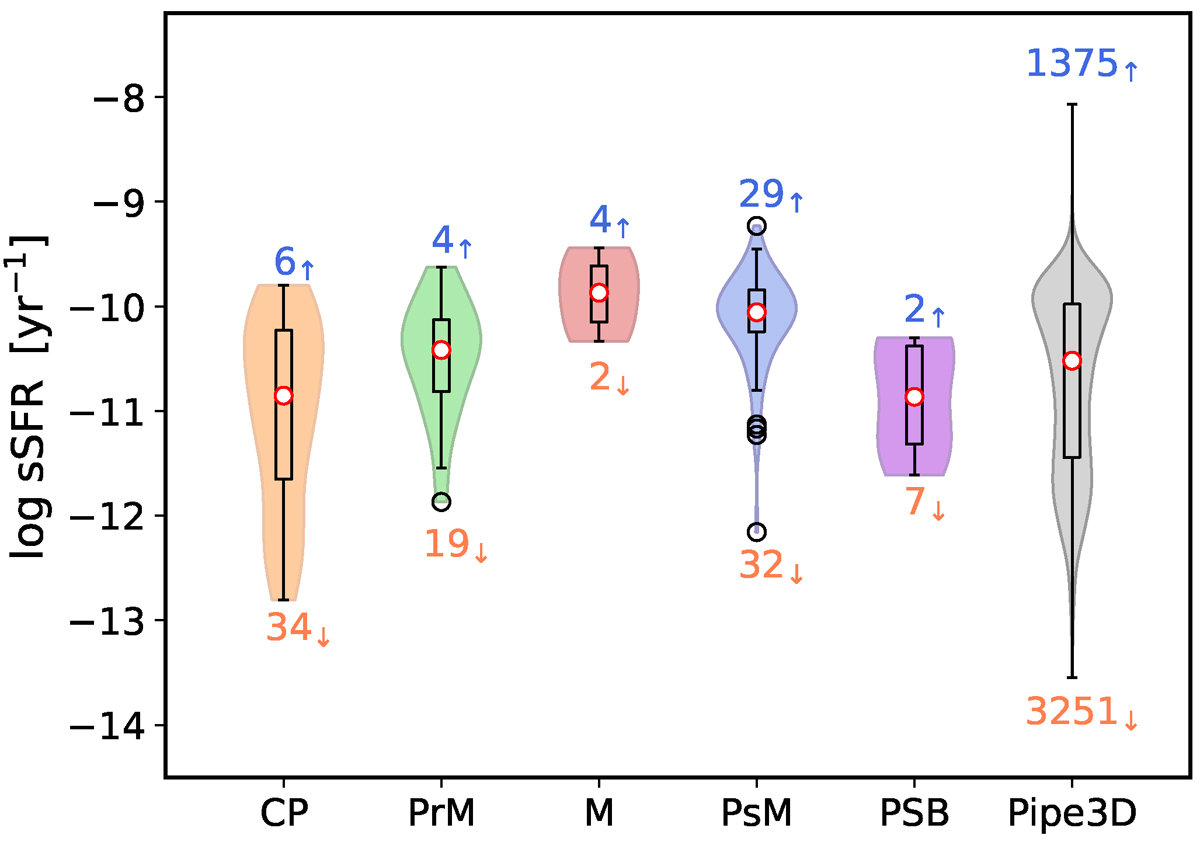
Download original image
Distribution of the integrated sSFR in the form of violin plots for each merger stage. The coloured area determines the density distribution for CP in orange, PrM in green, M in red, PsM in blue, and PSB in purple. For reference, the values of the integrated properties for all MaNGA galaxies (10010 galaxies) from the Pipe3D value-added catalogue (Sánchez et al. 2016a,b) have been added (in grey). The inner box on each violin plot is a representation of the interquartile range of the median (red dot) and its 95% of its confidence intervals. We also show the outlying points of the distributions (if any) as black open circles, which represent the atypical values for that category. The number of galaxies above and below the MS in Fig. 14 is indicated above and below the violin plots, respectively, while the total number of galaxies considered in each merger stage is presented in Table 1.
Current usage metrics show cumulative count of Article Views (full-text article views including HTML views, PDF and ePub downloads, according to the available data) and Abstracts Views on Vision4Press platform.
Data correspond to usage on the plateform after 2015. The current usage metrics is available 48-96 hours after online publication and is updated daily on week days.
Initial download of the metrics may take a while.