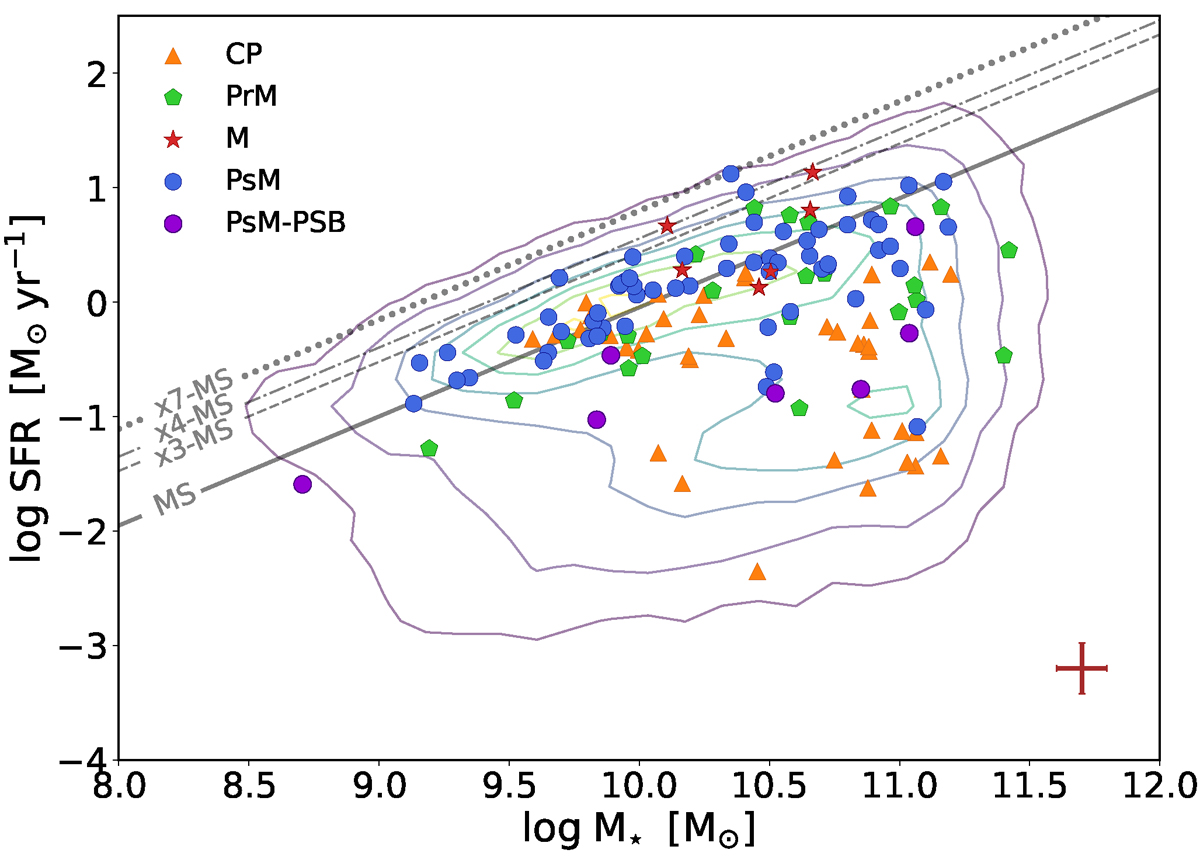
Fig. 13.
Download original image
Integrated SFR − M⋆ diagram for the 137 interacting galaxies in our sample. Galaxies classified as CP are represented by orange triangles, galaxies classified as PrM are represented by green hexagonal marks, M galaxies are represented by red stars, and galaxies classified as PsM are represented by blue and purple circles in the case of absence or presence of PSB emission, respectively. In the lower left-hand corner, we present a representative error, given by the mean value of the error of the integrated log SFRmean = 0.223 M⊙ yr−1 and the integrated log M⋆ mean = 0.097 M⊙. As reference, the contour backgrounds correspond to the integrated properties for all MaNGA galaxies from the Pipe3D value-added catalogue (Sánchez et al. 2016a,b), and the grey continuous line correspond to the ‘nurture’ free main sequence for star-forming galaxies derived by Argudo-Fernández et al. (2025). The dashed lines mark the locations with three, four, and seven times above the main sequence (along the SFR axis), respectively.
Current usage metrics show cumulative count of Article Views (full-text article views including HTML views, PDF and ePub downloads, according to the available data) and Abstracts Views on Vision4Press platform.
Data correspond to usage on the plateform after 2015. The current usage metrics is available 48-96 hours after online publication and is updated daily on week days.
Initial download of the metrics may take a while.