Fig. 12.
Download original image
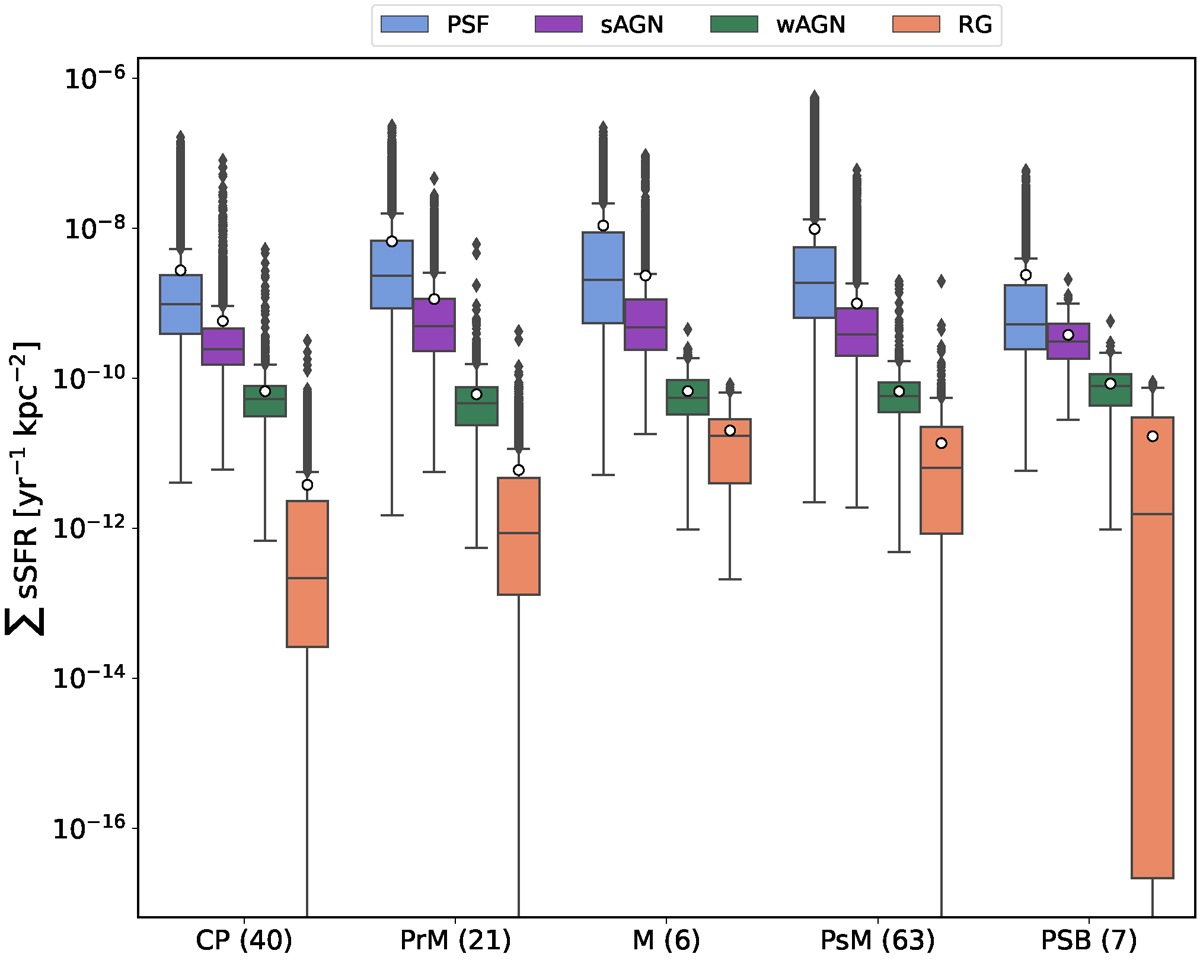
Distribution of the sSFR surface density (ΣsSFR) for spaxels in each WHAN category for each merger stage (the number of galaxies in each category is indicated in parentheses). The distributions are shown in the form of box plots, with a different colour for each WHAN category as in Fig. 11. The median values of the distributions are represented by a horizontal line within the box plots, while the mean values are represented by a white circle. Outlier values (larger than 1.5× the inter-quartile range) are represented by black diamonds. The distribution for passive galaxies is not presented since the values of the ΣsSFR are null.
Current usage metrics show cumulative count of Article Views (full-text article views including HTML views, PDF and ePub downloads, according to the available data) and Abstracts Views on Vision4Press platform.
Data correspond to usage on the plateform after 2015. The current usage metrics is available 48-96 hours after online publication and is updated daily on week days.
Initial download of the metrics may take a while.