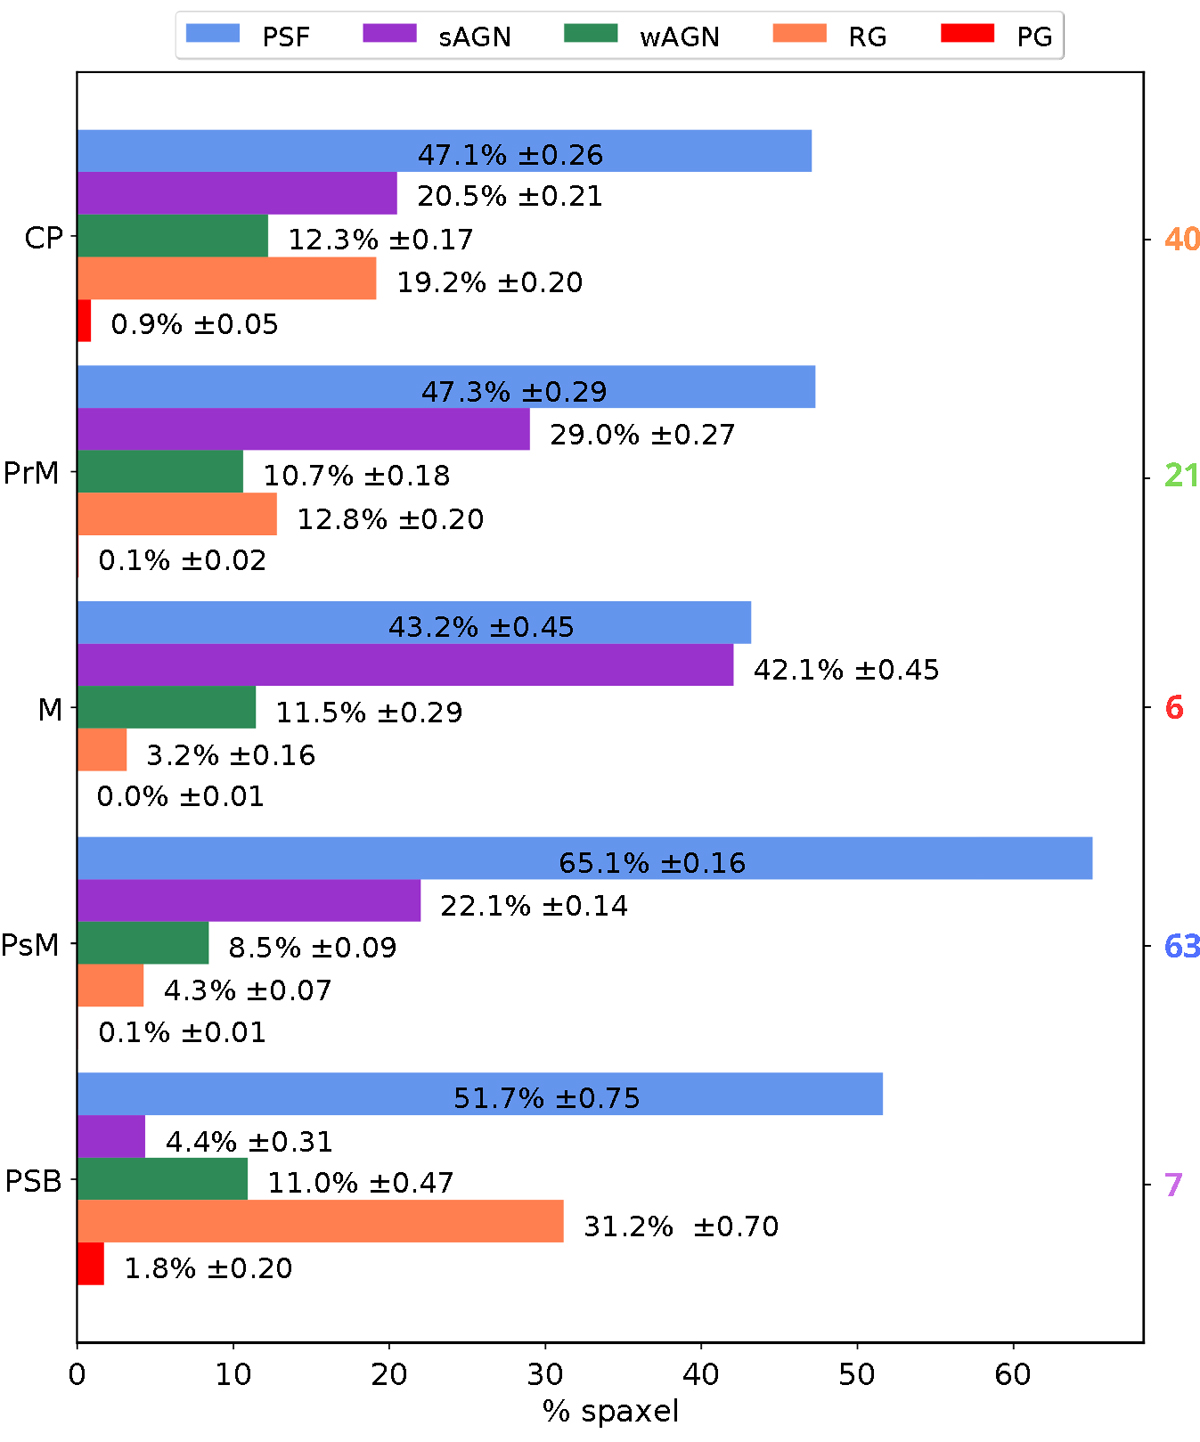
Fig. 11.
Download original image
Percentage of spaxels for each WHAN category for each merger stage. Blue colour bars represent the fractions of PSF spaxels, purple colour bars represent the fractions of sAGN spaxels, green colour bars represent the mean fractions of the wAGN spaxels, orange colour bars represent the fraction of spaxels classified as RG-like emission, and red colour bars represents the fraction of spaxels classified as PG-like emission, according to the WHAN diagnostic diagram. The number of galaxies in each merger stage is indicated in the right side, with text coloured as in Fig. 10.
Current usage metrics show cumulative count of Article Views (full-text article views including HTML views, PDF and ePub downloads, according to the available data) and Abstracts Views on Vision4Press platform.
Data correspond to usage on the plateform after 2015. The current usage metrics is available 48-96 hours after online publication and is updated daily on week days.
Initial download of the metrics may take a while.