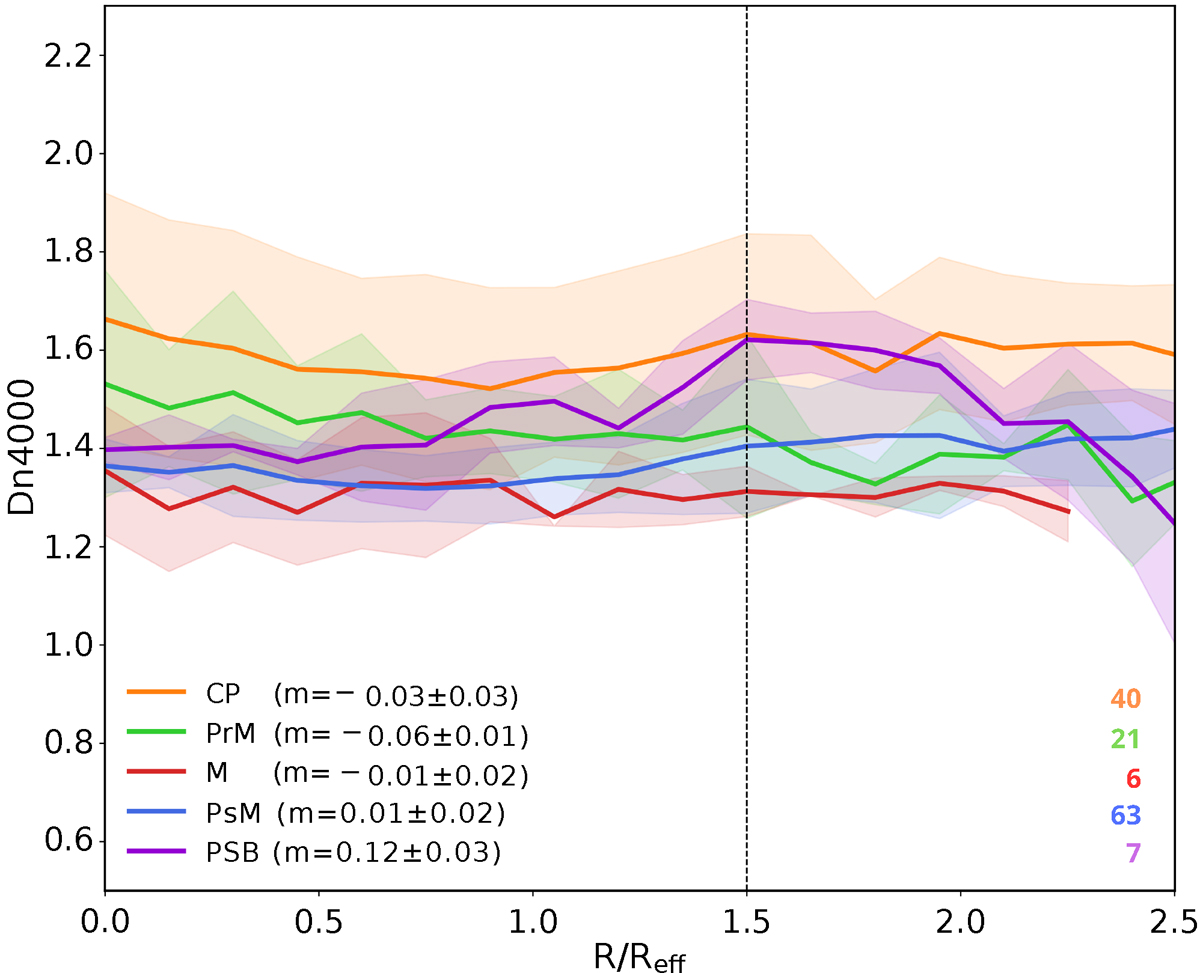
Fig. 10.
Download original image
Mean radial profiles of the Dn(4000) parameter with respect to R/Reff for all the galaxies in each merger stage. The radial profiles are represented in different colours for each merger stage according to the legend. Uncertainties are represented in the same colours at 1σ level. The slope, m, of the linear fit to the mean radial profile up to 1.5R/Reff (marked with a dashed vertical black line), with its corresponding uncertainties, are included in the legend for each merger stage. The number of galaxies in each merger stage is indicated in the lower right-hand corner, with text coloured as denoted in the legend.
Current usage metrics show cumulative count of Article Views (full-text article views including HTML views, PDF and ePub downloads, according to the available data) and Abstracts Views on Vision4Press platform.
Data correspond to usage on the plateform after 2015. The current usage metrics is available 48-96 hours after online publication and is updated daily on week days.
Initial download of the metrics may take a while.