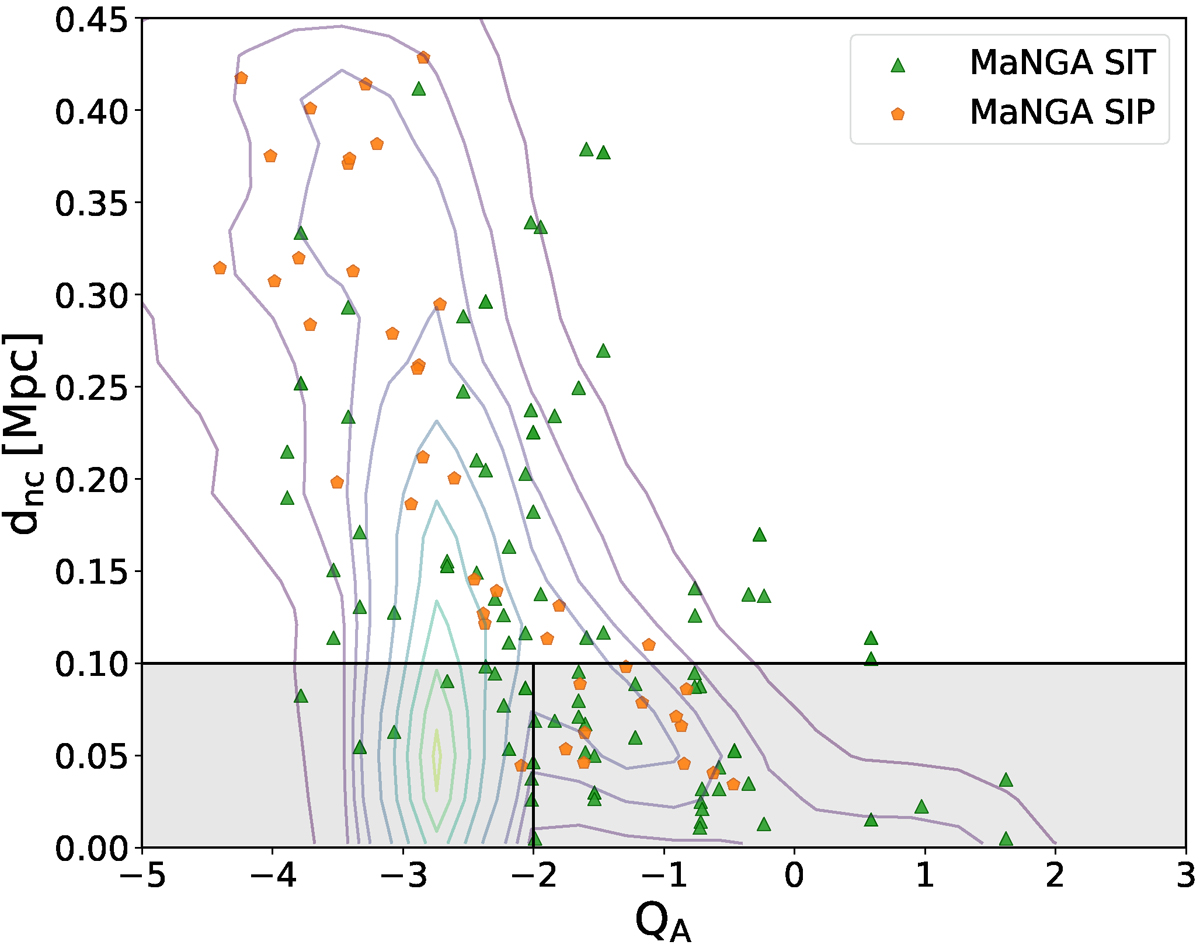
Fig. 1.
Download original image
Projected distance to the nearest companion dnc, in Mpc, with respect to the tidal strength of the central galaxy on the system QA. Contour lines correspond to all the galaxies in the SIP and SIT; green triangles and orange hexagons indicate galaxies in the SIT and SIP, respectively, from MaNGA data. The horizontal solid black line delimits the grey shaded area with dnc ≤ 100 kpc that we use to delimit close pairs. Within this area, the vertical solid black line at QA = − 2 is used to identify interacting galaxies, following Vásquez-Bustos et al. (2023).
Current usage metrics show cumulative count of Article Views (full-text article views including HTML views, PDF and ePub downloads, according to the available data) and Abstracts Views on Vision4Press platform.
Data correspond to usage on the plateform after 2015. The current usage metrics is available 48-96 hours after online publication and is updated daily on week days.
Initial download of the metrics may take a while.