Fig. 9.
Download original image
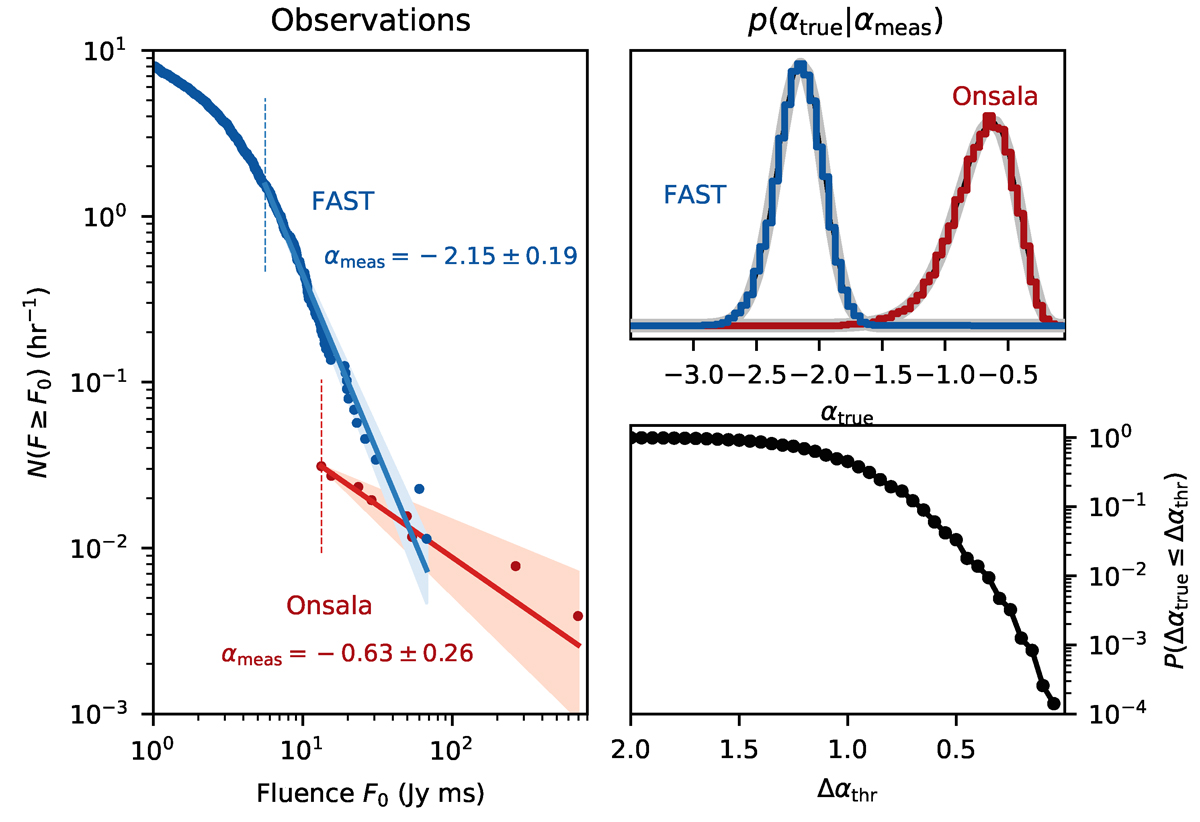
Left: Survival functions of the fluence distributions from the FAST and Onsala observations during the S21 activity window, together with MLE PL fits. The vertical lines mark the optimal minimum fluence as found by the powerlaw package, after modification according to Eqs. (A.2)–(A.3) in Appendix A. Top right: Posterior distributions of αt|αm. The gray lines indicate gamma distributions from Eq. (2). Bottom right: Probability of αt(Onsala)−αt(FAST) being smaller than the threshold value.
Current usage metrics show cumulative count of Article Views (full-text article views including HTML views, PDF and ePub downloads, according to the available data) and Abstracts Views on Vision4Press platform.
Data correspond to usage on the plateform after 2015. The current usage metrics is available 48-96 hours after online publication and is updated daily on week days.
Initial download of the metrics may take a while.