Fig. 8.
Download original image
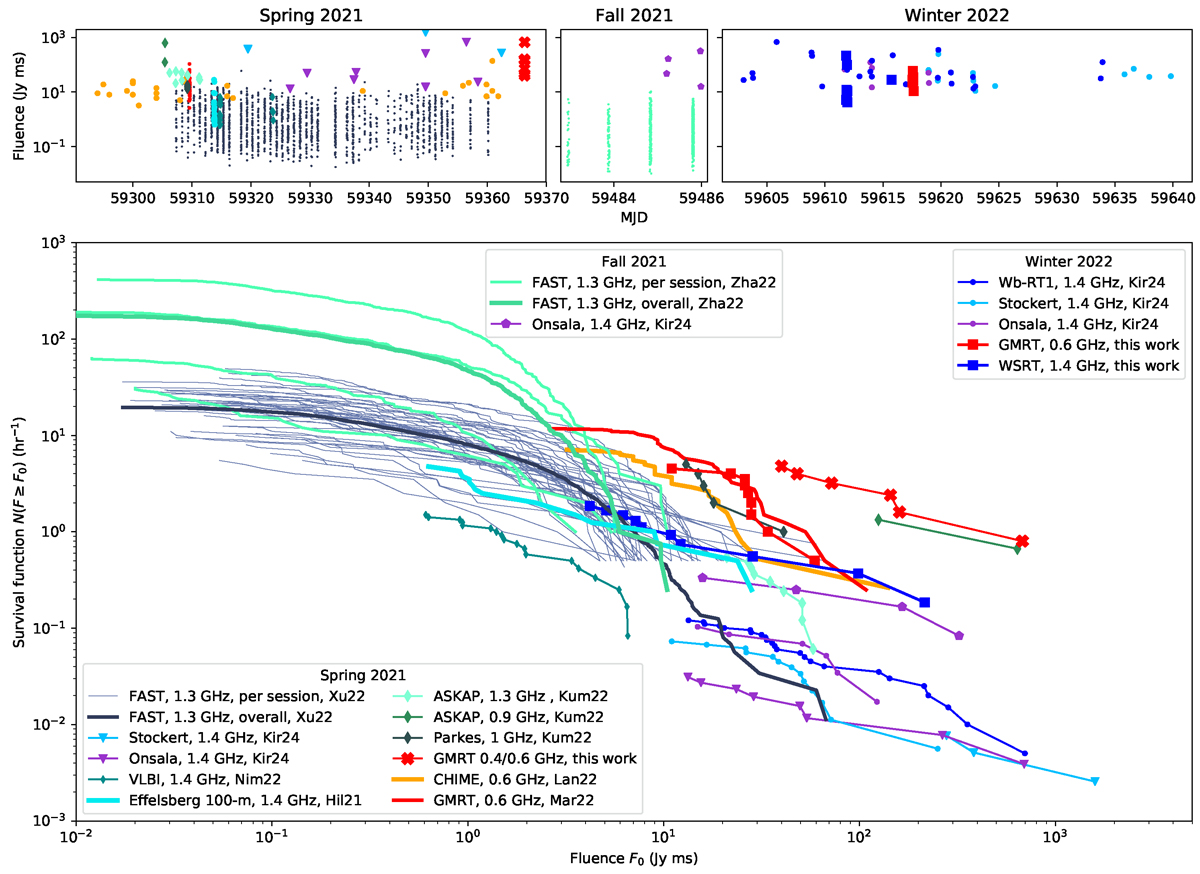
Upper row: FRB fluence vs. MJD of arrival for three activity windows. The markers and colors correspond to the legend in the lower panel (see inset), which shows rate survival function vs. burst fluence. FRB information was collected from Lanman et al. (2022, Lan22), Xu et al. (2022, Xu21), Nimmo et al. (2022, Nim22), Hilmarsson et al. (2021, Hil21), Kumar et al. (2022, Kum22), Marthi et al. (2022, Mar22), Zhang et al. (2022, Zha22), and Kirsten et al. (2024, Kir24). Where possible, fluence distributions obtained from observations on different days and with different telescopes were computed separately.
Current usage metrics show cumulative count of Article Views (full-text article views including HTML views, PDF and ePub downloads, according to the available data) and Abstracts Views on Vision4Press platform.
Data correspond to usage on the plateform after 2015. The current usage metrics is available 48-96 hours after online publication and is updated daily on week days.
Initial download of the metrics may take a while.