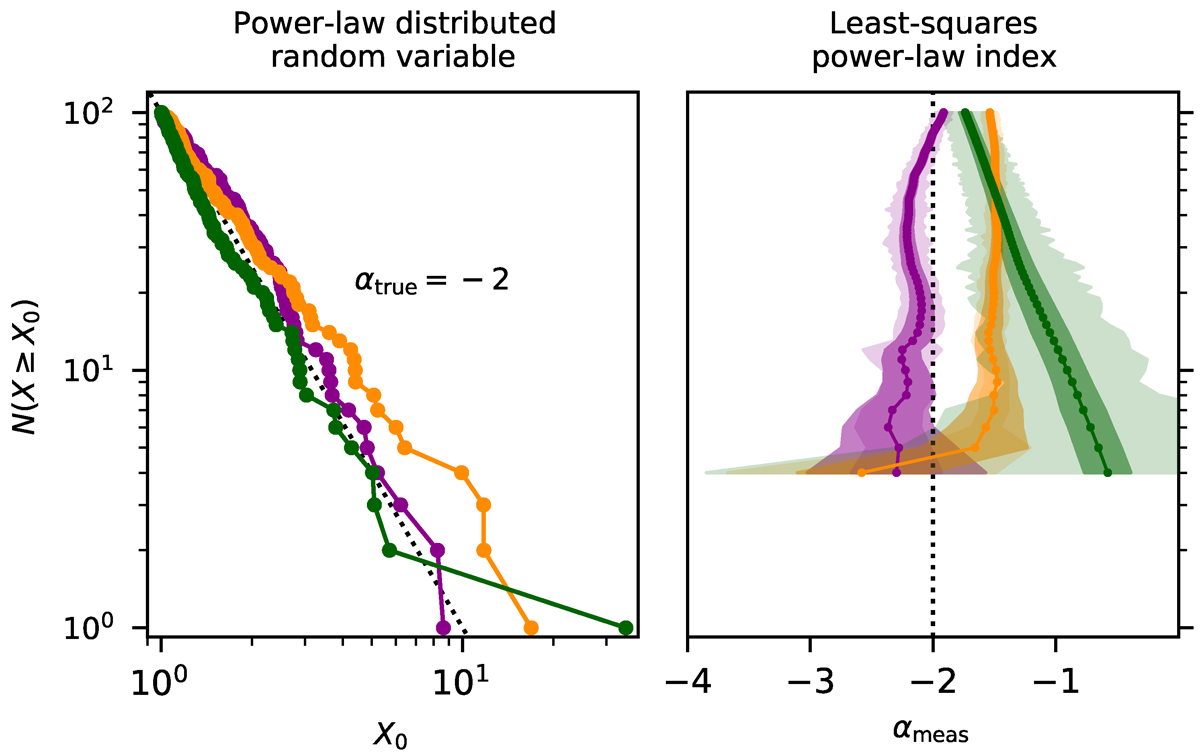
Fig. A.1.
Download original image
Left: Survival functions for three N = 100 samples of simulated random variables distributed according to Eq. A.1 with αt = −2. Right: PLI αm obtained with the least-squares method for the subsamples consisting of 4 ≤ N ≤ 100 elements sorted in decreasing order. The shaded regions mark the standard least-squares error (darker shade) and the bootstrapping error (lighter shade).
Current usage metrics show cumulative count of Article Views (full-text article views including HTML views, PDF and ePub downloads, according to the available data) and Abstracts Views on Vision4Press platform.
Data correspond to usage on the plateform after 2015. The current usage metrics is available 48-96 hours after online publication and is updated daily on week days.
Initial download of the metrics may take a while.