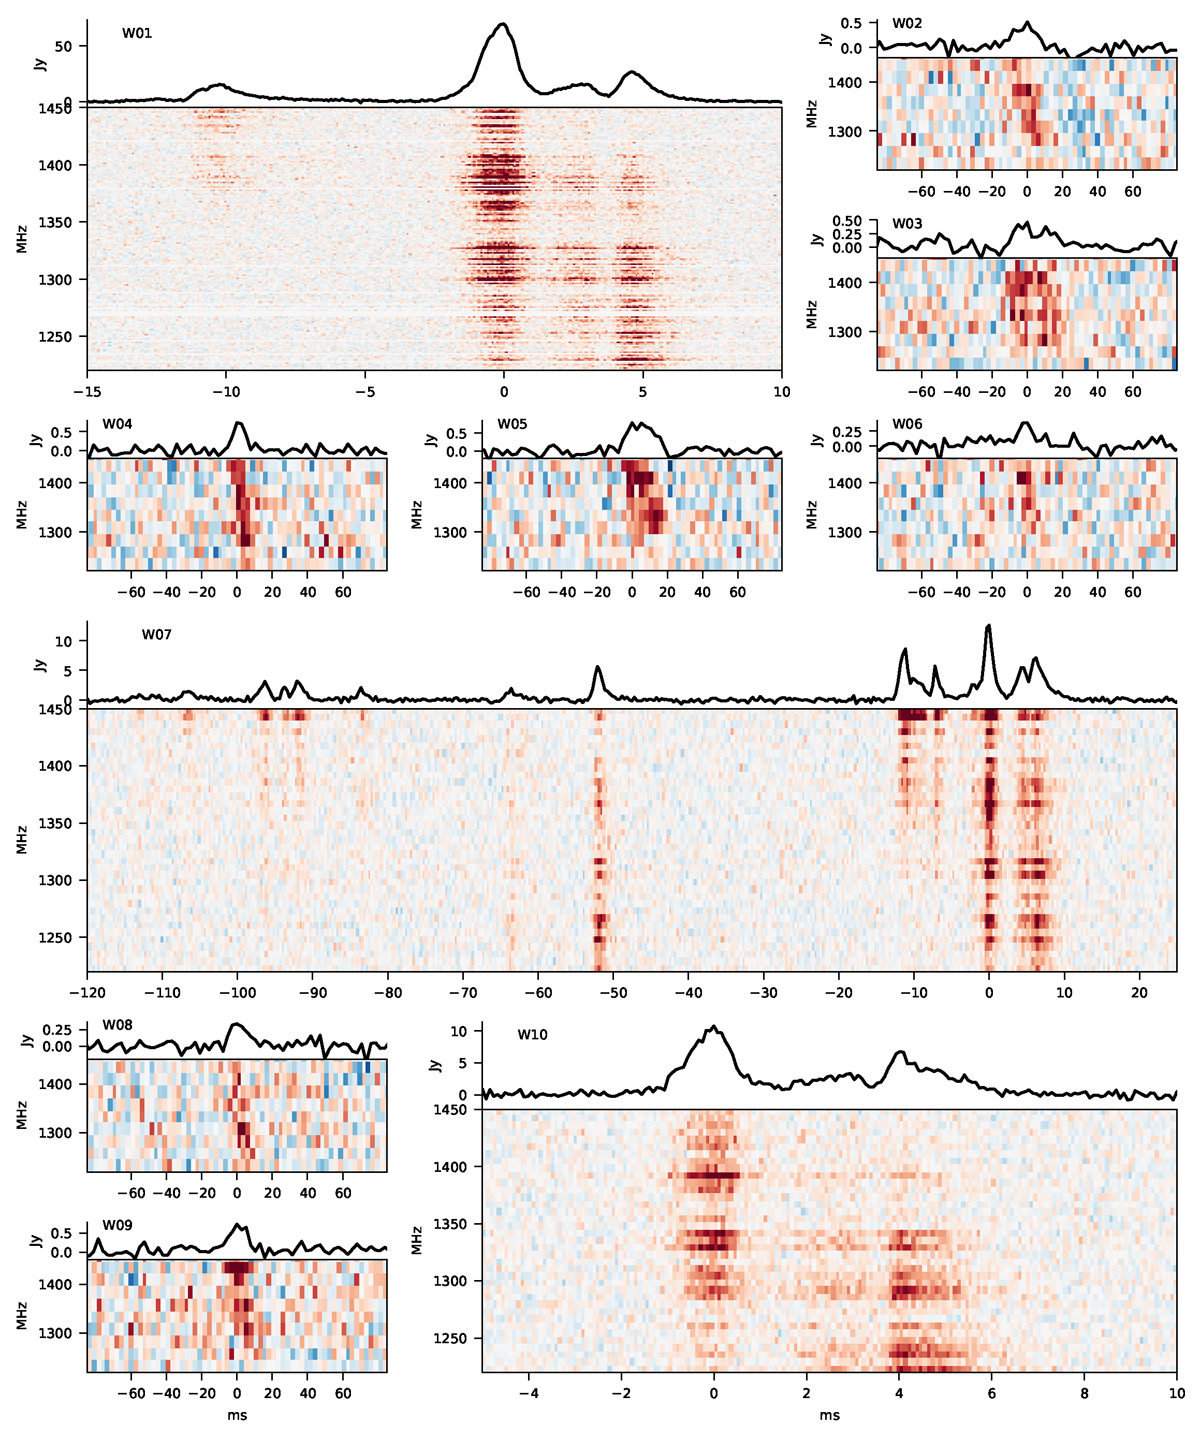
Fig. 2.
Download original image
Spectra (bottom subpanels) and intensity profiles, integrated over the frequency band (top subpanels), of the ten bursts discovered within the ALERT survey. For plotting, the spectra were normalized by the mean and the standard deviation in the off-burst region in each sub-band, and the colors were saturated at ±10σ for W01, W07, and W10, and at ±4σ for the other bursts. Bursts W01 and W10 are plotted with the original tres = 81.9 μs, burst W07 with 0.33 ms and the rest with 2.62 ms. The frequency resolution is 25 MHz for all bursts except W07 and W10 (6.25 MHz), and W01 (0.48 MHz). The time in ms is zeroed on the burst peak. Spectra at frequencies above 1450 MHz are not shown, since the signal there is mostly corrupted by RFI.
Current usage metrics show cumulative count of Article Views (full-text article views including HTML views, PDF and ePub downloads, according to the available data) and Abstracts Views on Vision4Press platform.
Data correspond to usage on the plateform after 2015. The current usage metrics is available 48-96 hours after online publication and is updated daily on week days.
Initial download of the metrics may take a while.