Fig. 18.
Download original image
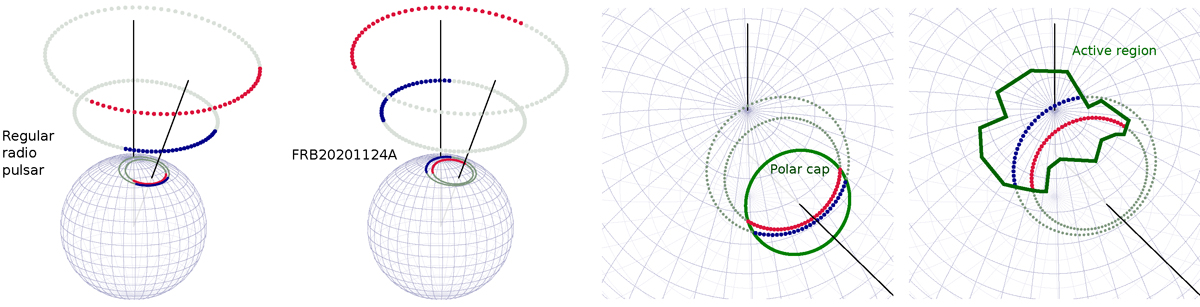
Radius-to-frequency mapping of radio emission observed at two radio frequencies together with the footpoints of visible emission lines on the surface of the star for radio pulsars (left column) and FRB 20201124A (right column). Spin and magnetic axis are marked with vertical and inclined lines, respectively. The path of the LOS and corresponding line footpoints are shown with circle markers, gray for no emission, and red (resp. blue) for low (resp. high) frequency. For radio pulsars, only open field lines originating within the polar cap (green circle) can produce radio emission. At lower frequencies the LOS spends more time within the polar cap, resulting in a widening of observed radio profile. For FRB 20201124A, emission is not restricted to the open field lines and comes from an active region of unknown shape. At the end of the S21 activity window the LOS crossed the edge of an active region (right edge on the figure) in two places, with the edge point corresponding to the lower radio frequency extending farther along the LOS path.
Current usage metrics show cumulative count of Article Views (full-text article views including HTML views, PDF and ePub downloads, according to the available data) and Abstracts Views on Vision4Press platform.
Data correspond to usage on the plateform after 2015. The current usage metrics is available 48-96 hours after online publication and is updated daily on week days.
Initial download of the metrics may take a while.