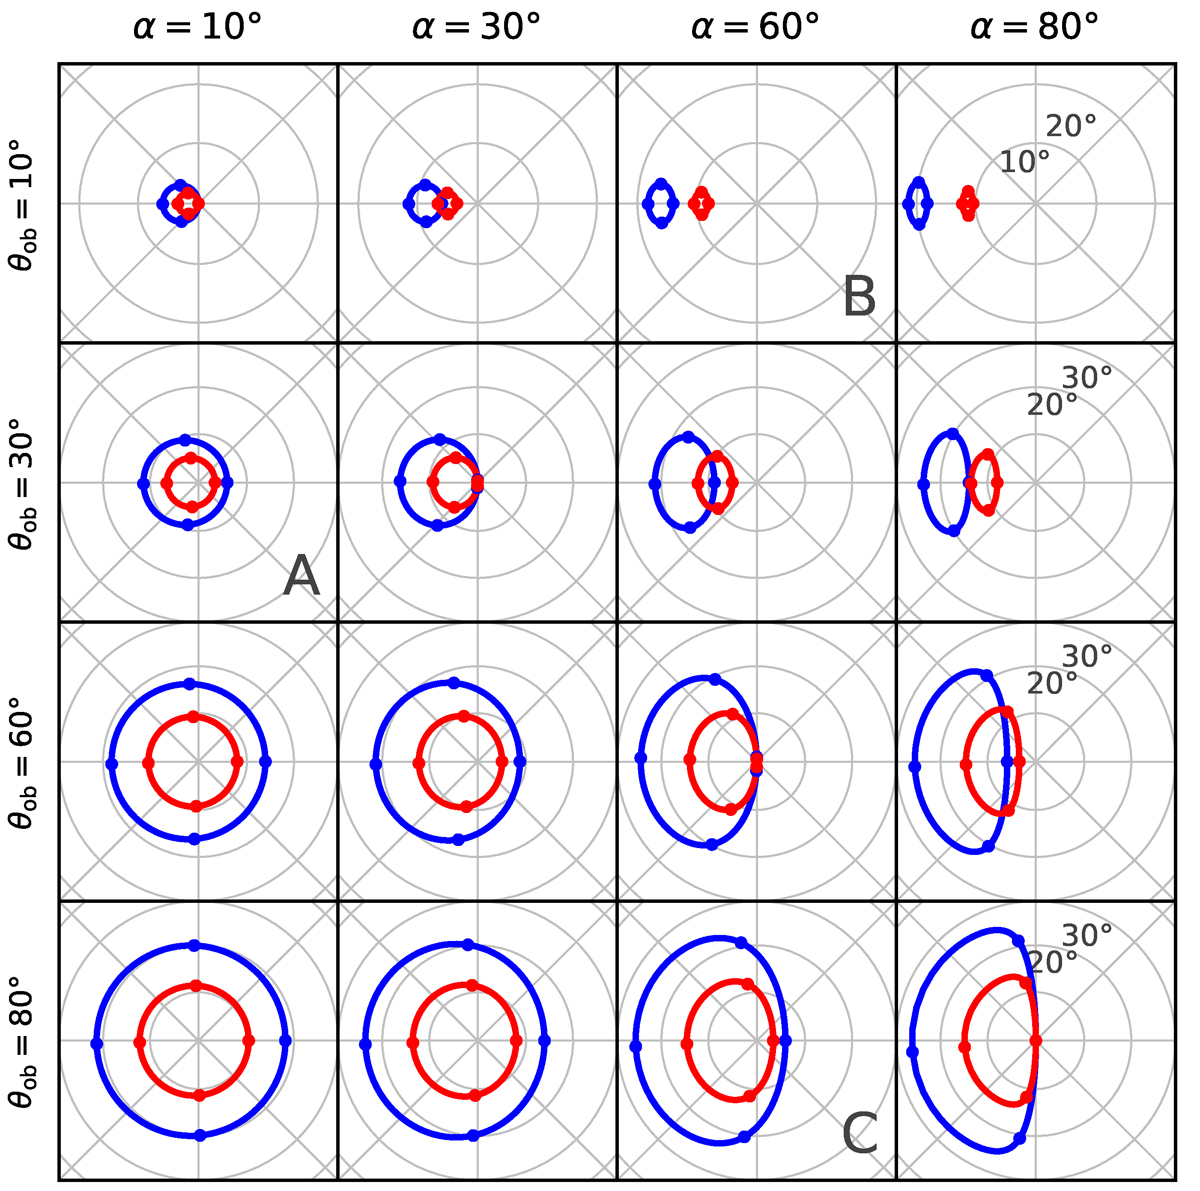
Fig. 16.
Download original image
Maps of footpoint loops spanning all geometries. Shown are the coordinates of the footpoints of the magnetic field lines which are potentially visible for a LOS characterized by viewing angle θob, as it passes through a dipole field inclined to spin axis by an angle α. The line colors reflect the observing frequencies shown in Fig. 15. The blue loop corresponds to emission seen at WSRT frequencies νhi = 1300 MHz, coming from chosen emission altitude rhi = 5RNS; while the red loop contains the footpoints visible in the lower GMRT band νlow = 430 MHz, from rlow = 15RNS. The dots mark the quarters of the magnetar rotation. The coordinate system is centered on the magnetic dipole axis. The letters indicate the sets of geometry angles with emission regions plotted in Fig. 17.
Current usage metrics show cumulative count of Article Views (full-text article views including HTML views, PDF and ePub downloads, according to the available data) and Abstracts Views on Vision4Press platform.
Data correspond to usage on the plateform after 2015. The current usage metrics is available 48-96 hours after online publication and is updated daily on week days.
Initial download of the metrics may take a while.