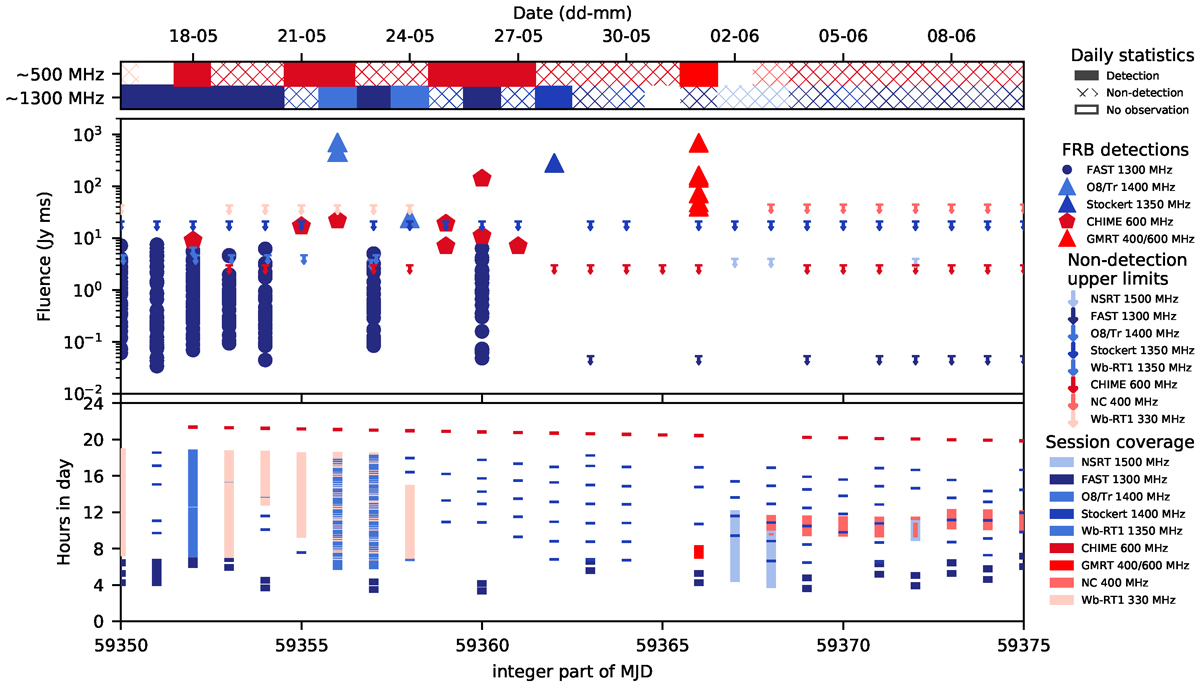
Fig. 15.
Download original image
Upper panel: Overview of daily detection statistics at the end of S21 activity window from all telescopes combined. A filled rectangle indicates that the source was detected, a hatched rectangle for non-detected, and a white rectangle signifies there were no observations that day. Lower frequencies are shown at the top, following Sect. 5.1. Middle panel: FRB fluences, together with upper limits for non-detections vs. the integer part of the observation MJD. The time region around the end of the S21 activity window is shown. The red triangles mark GMRT observations at 400 or 650 MHz (bursts G01–G06 from Fig. 1). The darker and lighter red shades show detections (pentagons) or upper limits for bursts in similar frequency regions from the observations by CHIME/FRB (Lanman et al. 2022) and NC (Trudu et al. 2022). The results of higher-frequency L-band observations by FAST (Xu et al. 2022) and NSRT (Mao et al. 2022) are shown in darker and lighter blue, with dots marking FAST detections. Detections by Torun/Onsala/Stockert (T/O/S) dishes from Kirsten et al. (2024) are shown as blue triangles (see text for details on fluence upper limits). Lower panel: Observation time coverage.
Current usage metrics show cumulative count of Article Views (full-text article views including HTML views, PDF and ePub downloads, according to the available data) and Abstracts Views on Vision4Press platform.
Data correspond to usage on the plateform after 2015. The current usage metrics is available 48-96 hours after online publication and is updated daily on week days.
Initial download of the metrics may take a while.