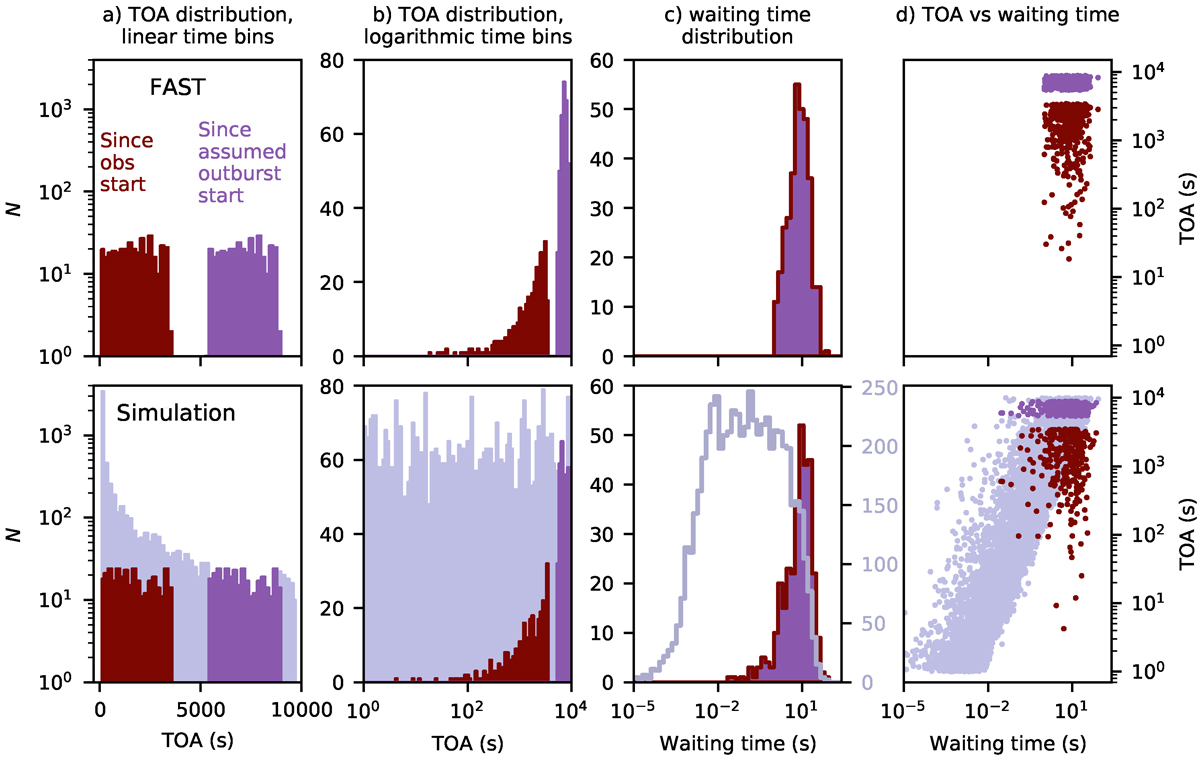
Fig. 14.
Download original image
TOA and waiting time distribution for the most prolific FRB 20201124A observing session from Zhang et al. (2022) on MJD 59486 (upper row), and a series of log-uniform random variables (lower row) that simulate an FRB outburst. In our model only a small fraction of the outburst duration is covered by observations, long after the burst onset. The columns are: a) distribution of TOAs measured from the first burst arrival (brown) and from the hypothetical outburst start (violet), with the pale shade of violet showing the whole underlying mostly unobserved outburst; b) same distribution, but binned with logarithmic time bins; c) distribution of TOAs vs. waiting time between two bursts; d) distribution of waiting times. Bursts separated by less than 400 ms combined, producing a single TOA for the start of the combined burst.
Current usage metrics show cumulative count of Article Views (full-text article views including HTML views, PDF and ePub downloads, according to the available data) and Abstracts Views on Vision4Press platform.
Data correspond to usage on the plateform after 2015. The current usage metrics is available 48-96 hours after online publication and is updated daily on week days.
Initial download of the metrics may take a while.