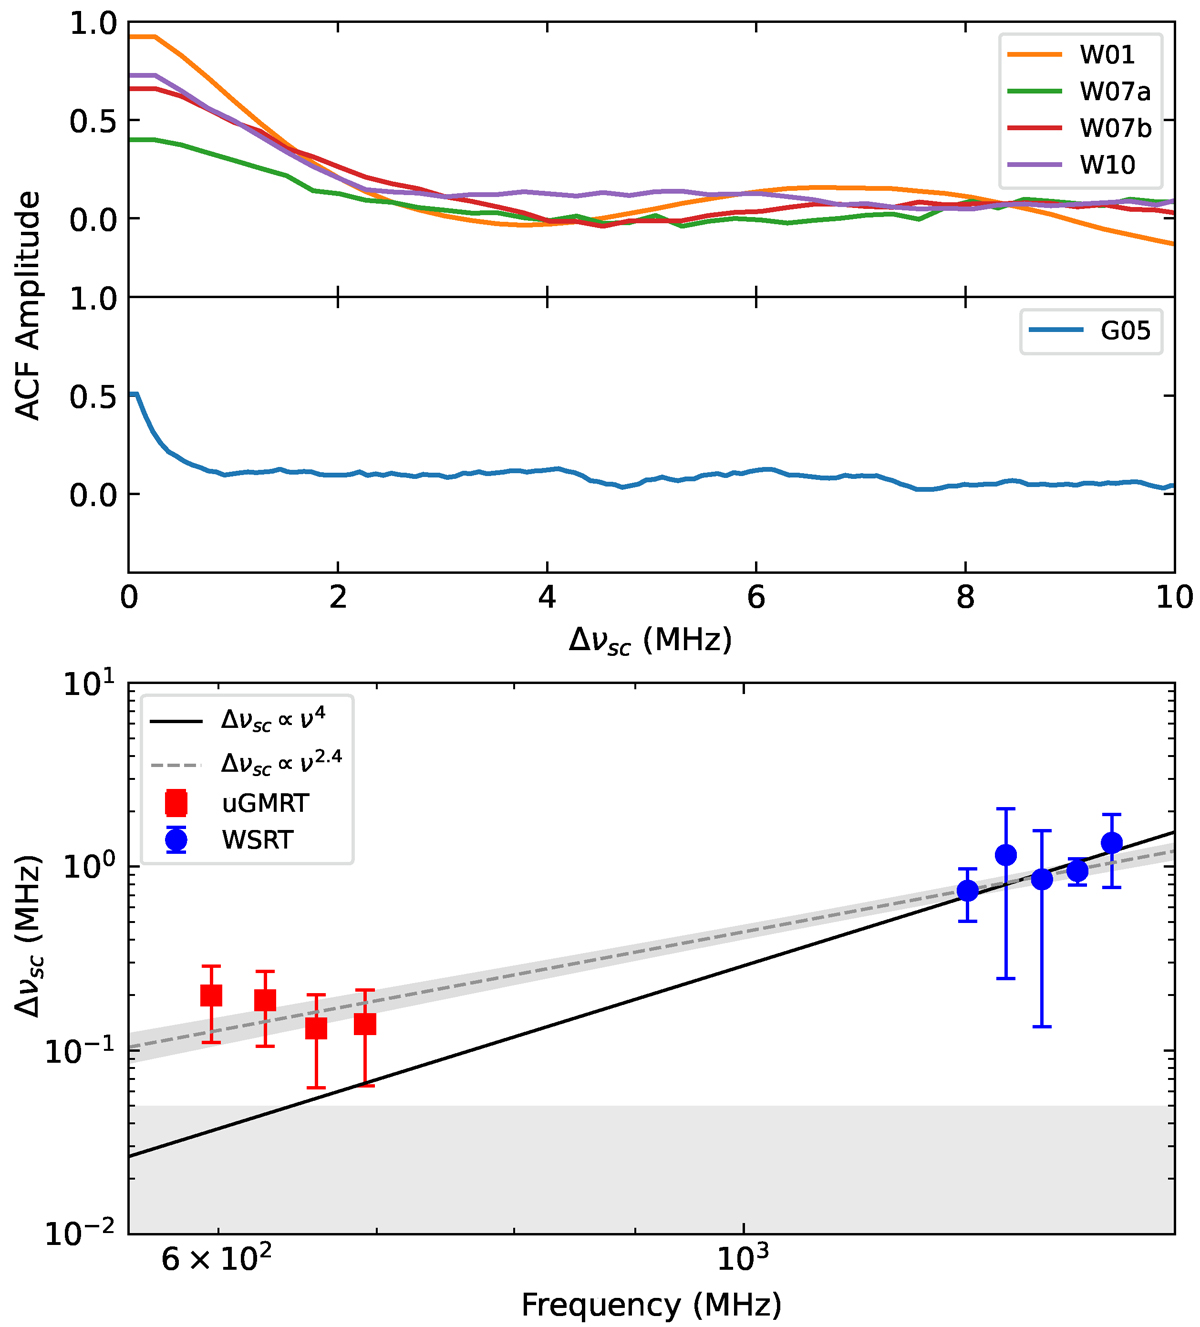
Fig. 13.
Download original image
Decorrelation bandwidth analysis. The top panel shows the ACF from 1220 MHz to 1453 MHz of the Apertif bursts W01 (orange), W07a (green), W07b (red), W10 (purple), and G05 (blue). The middle panel shows the ACF from 580 to 709 MHz of the uGMRT burst G05 in blue. The bottom panel shows how the decorrelation bandwidth evolves with frequency. The Apertif bandwidths were divided into five sub-bands, and the uGMRT bandwidth into four sub-bands. The gray dashed line with a shaded area shows the best-fitting power law, with an index α = 2.4 ± 0.2. As a reference, the black solid line shows an index α = 4 expected from a thin screen. The gray shaded region indicates decorrelation bandwidths that cannot be resolved by the uGMRT resolution.
Current usage metrics show cumulative count of Article Views (full-text article views including HTML views, PDF and ePub downloads, according to the available data) and Abstracts Views on Vision4Press platform.
Data correspond to usage on the plateform after 2015. The current usage metrics is available 48-96 hours after online publication and is updated daily on week days.
Initial download of the metrics may take a while.