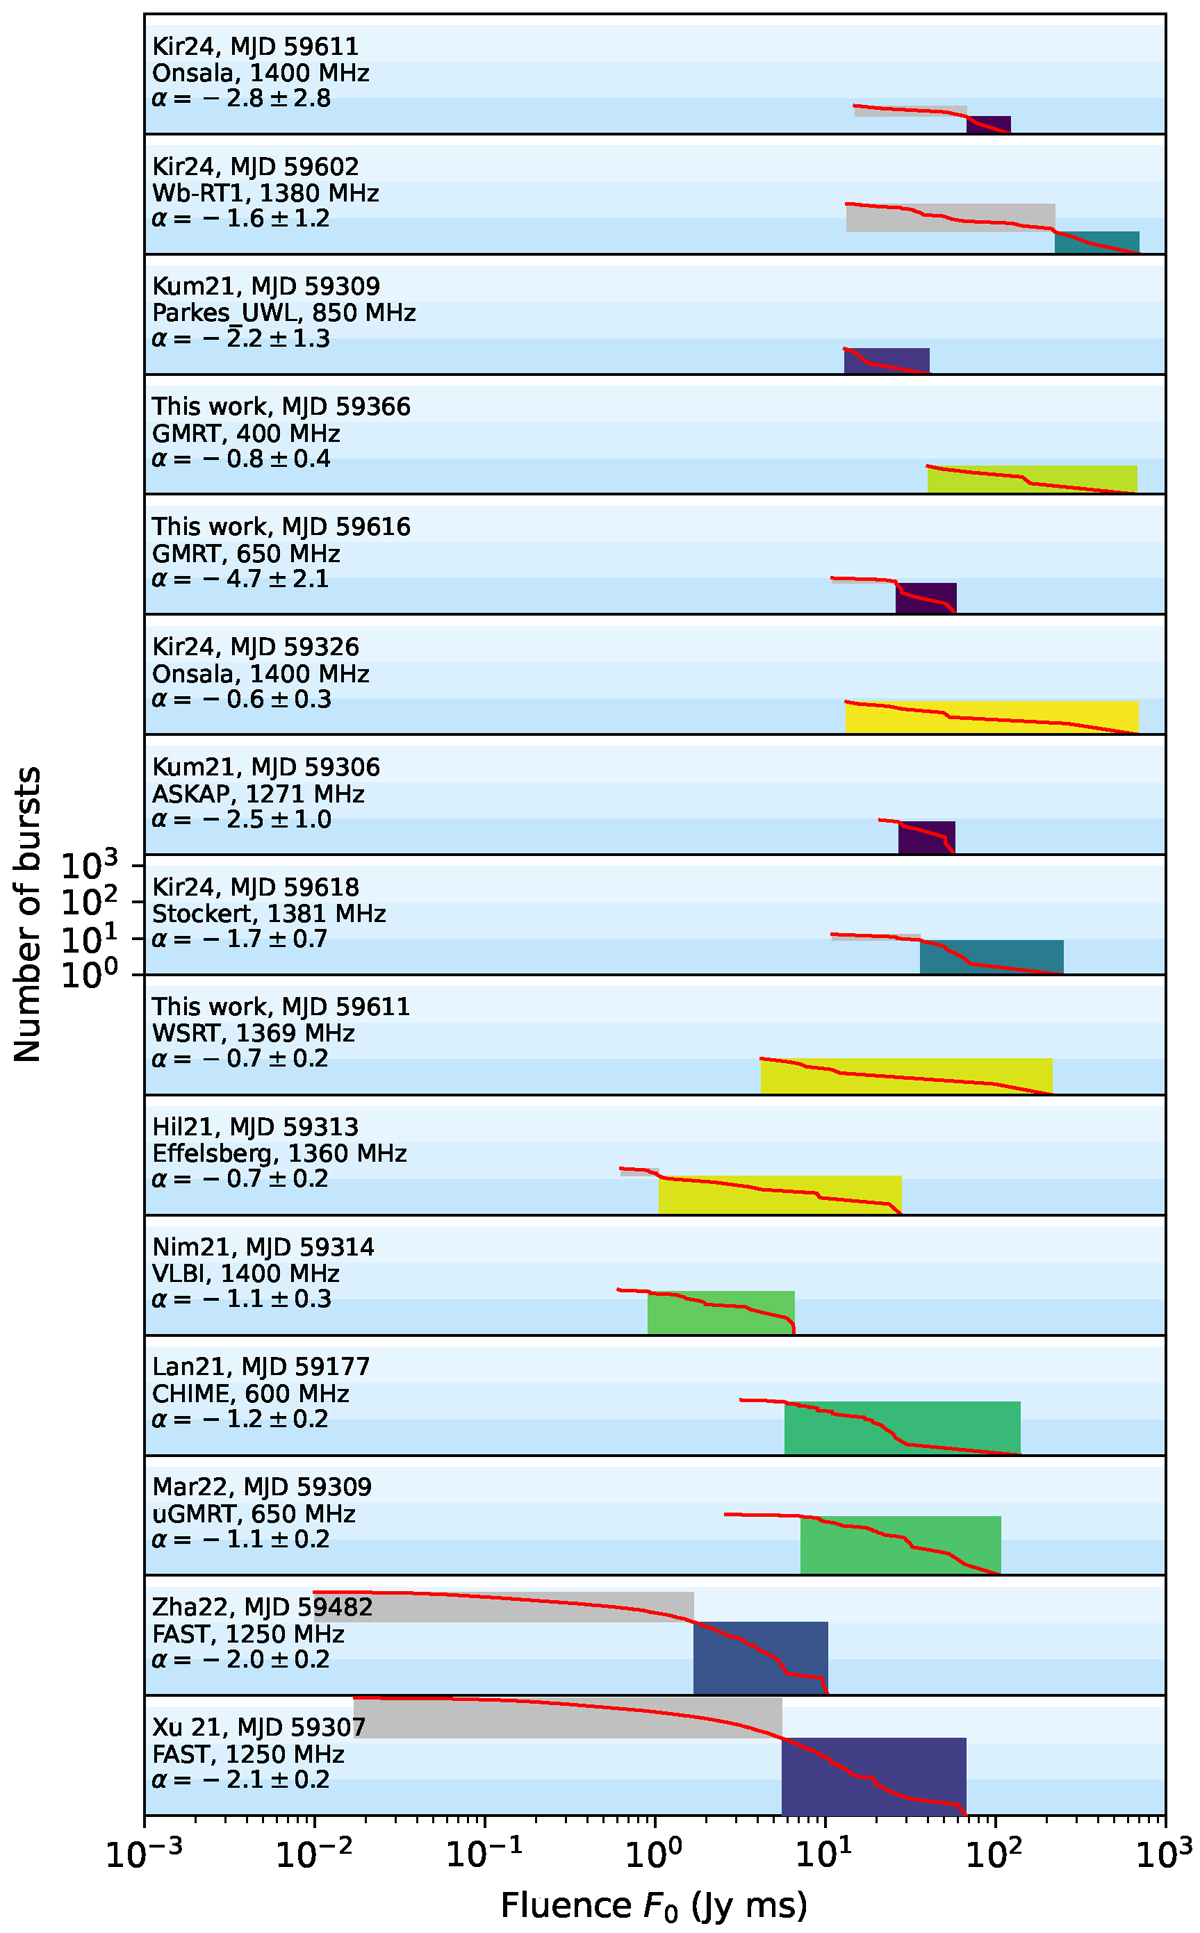
Fig. 12.
Download original image
Un-normalized survival function of the fluence distributions for the bursts recorded in the previous studies and current work (see caption of Fig. 11 for the explanation of the legend and caption of Fig. 8 for the literature abbreviations). Here the burst samples are ordered by the number of bursts in the best-fitting PL tail. MJD refers to the start of respective observing campaigns.
Current usage metrics show cumulative count of Article Views (full-text article views including HTML views, PDF and ePub downloads, according to the available data) and Abstracts Views on Vision4Press platform.
Data correspond to usage on the plateform after 2015. The current usage metrics is available 48-96 hours after online publication and is updated daily on week days.
Initial download of the metrics may take a while.