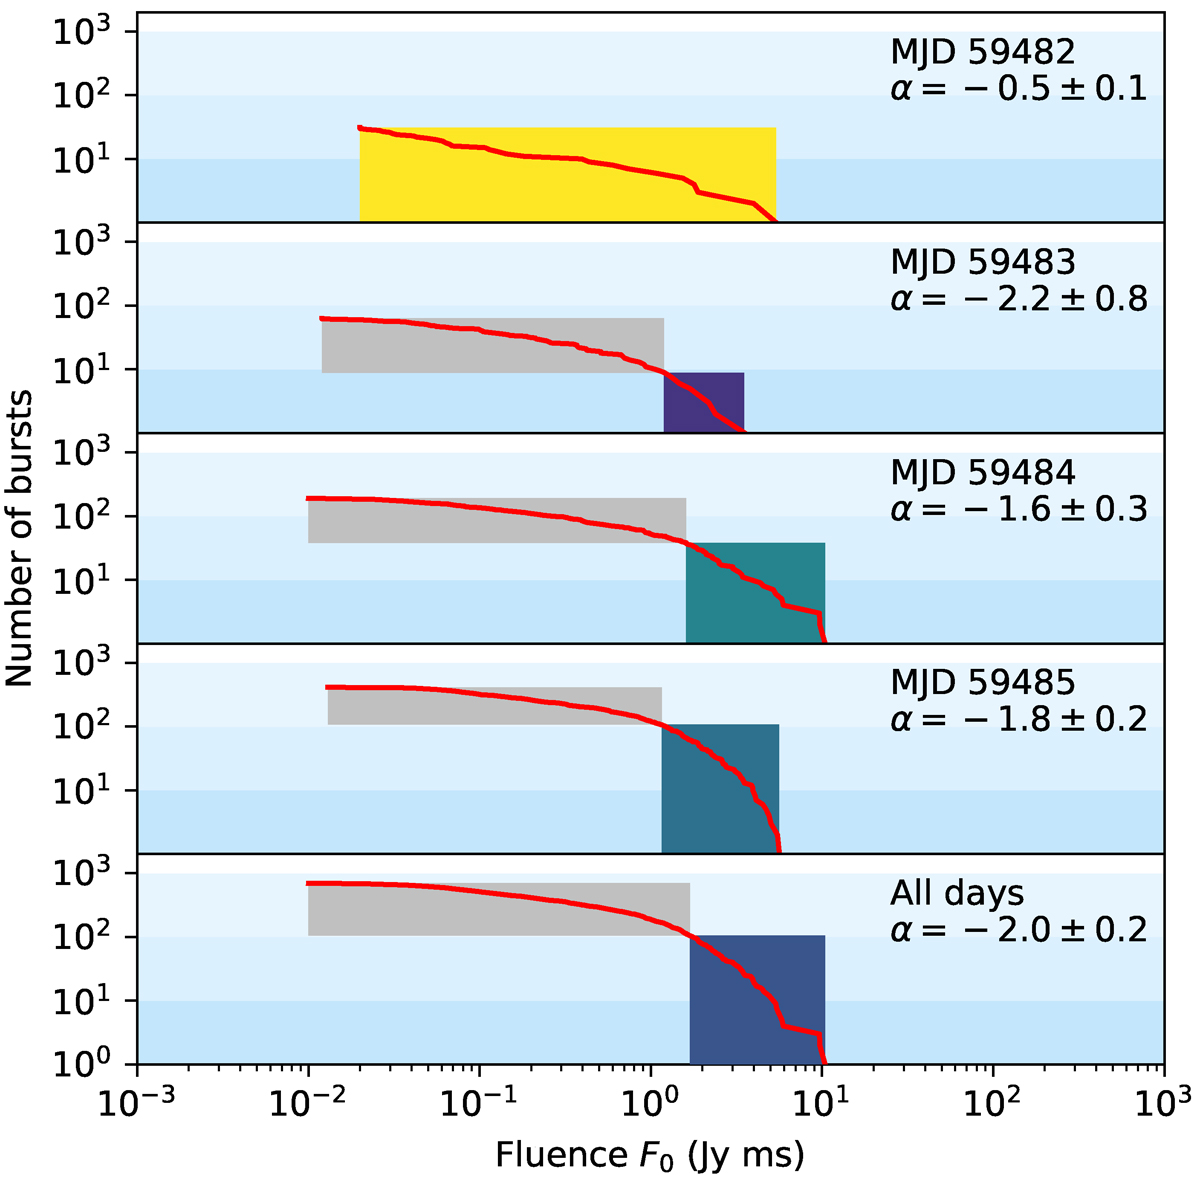
Fig. 11.
Download original image
Un-normalized survival function of the fluence distributions (red line) for the bursts recorded at the end of F21 activity window (Zhang et al. 2022). The gray rectangles mark the regions in the fluence–burst number parameter space that contain bursts excluded from the PL fit (see Section 4.3.2 for details). The colored rectangles contain bursts included in the fit; the color represents the steepness of the best-fit power-law index (PLI) ranging from light yellow (αm = −0.5) to dark blue (αm = −2.5). Light blue bands of progressively lighter shades in the background correspond to regions containing 10, 100, and 1000 bursts.
Current usage metrics show cumulative count of Article Views (full-text article views including HTML views, PDF and ePub downloads, according to the available data) and Abstracts Views on Vision4Press platform.
Data correspond to usage on the plateform after 2015. The current usage metrics is available 48-96 hours after online publication and is updated daily on week days.
Initial download of the metrics may take a while.