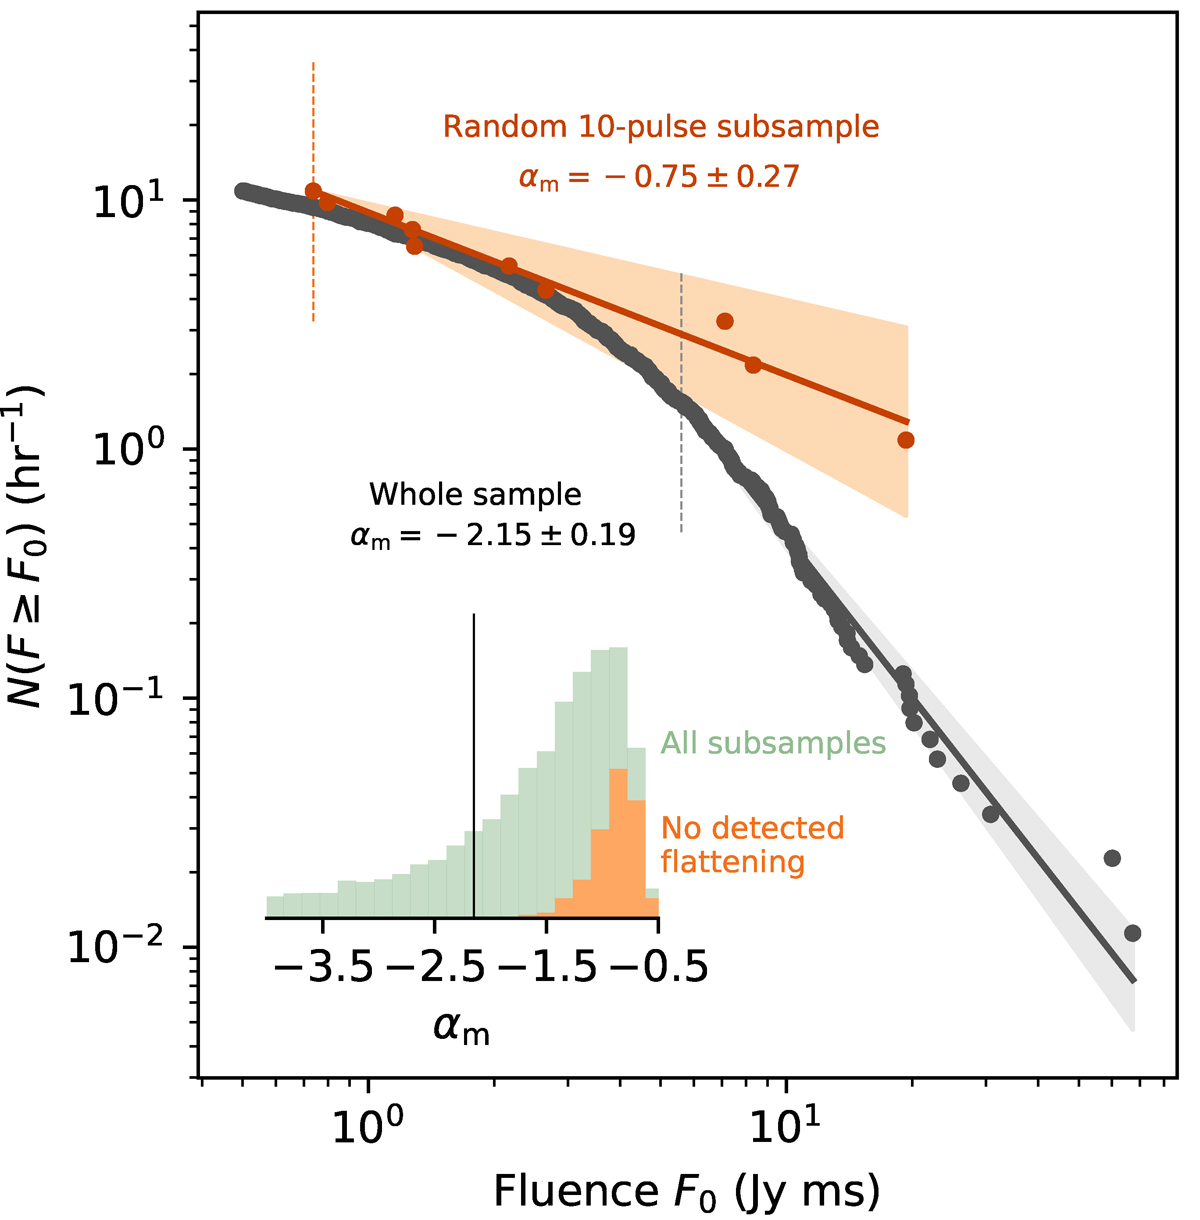
Fig. 10.
Download original image
Survival functions of the fluence distribution from the S21 FAST bursts (Xu et al. 2022) with fluences larger than 0.5 Jy ms, together with an example survival function from a random ten-pulse subsample. The vertical lines indicate the optimal minimum fluence values from the PL fit. The example survival function does not show apparent flattening. Inset: Distribution of αm for all 104 ten-pulse subsamples (green) and those that do not show flattening (orange).
Current usage metrics show cumulative count of Article Views (full-text article views including HTML views, PDF and ePub downloads, according to the available data) and Abstracts Views on Vision4Press platform.
Data correspond to usage on the plateform after 2015. The current usage metrics is available 48-96 hours after online publication and is updated daily on week days.
Initial download of the metrics may take a while.