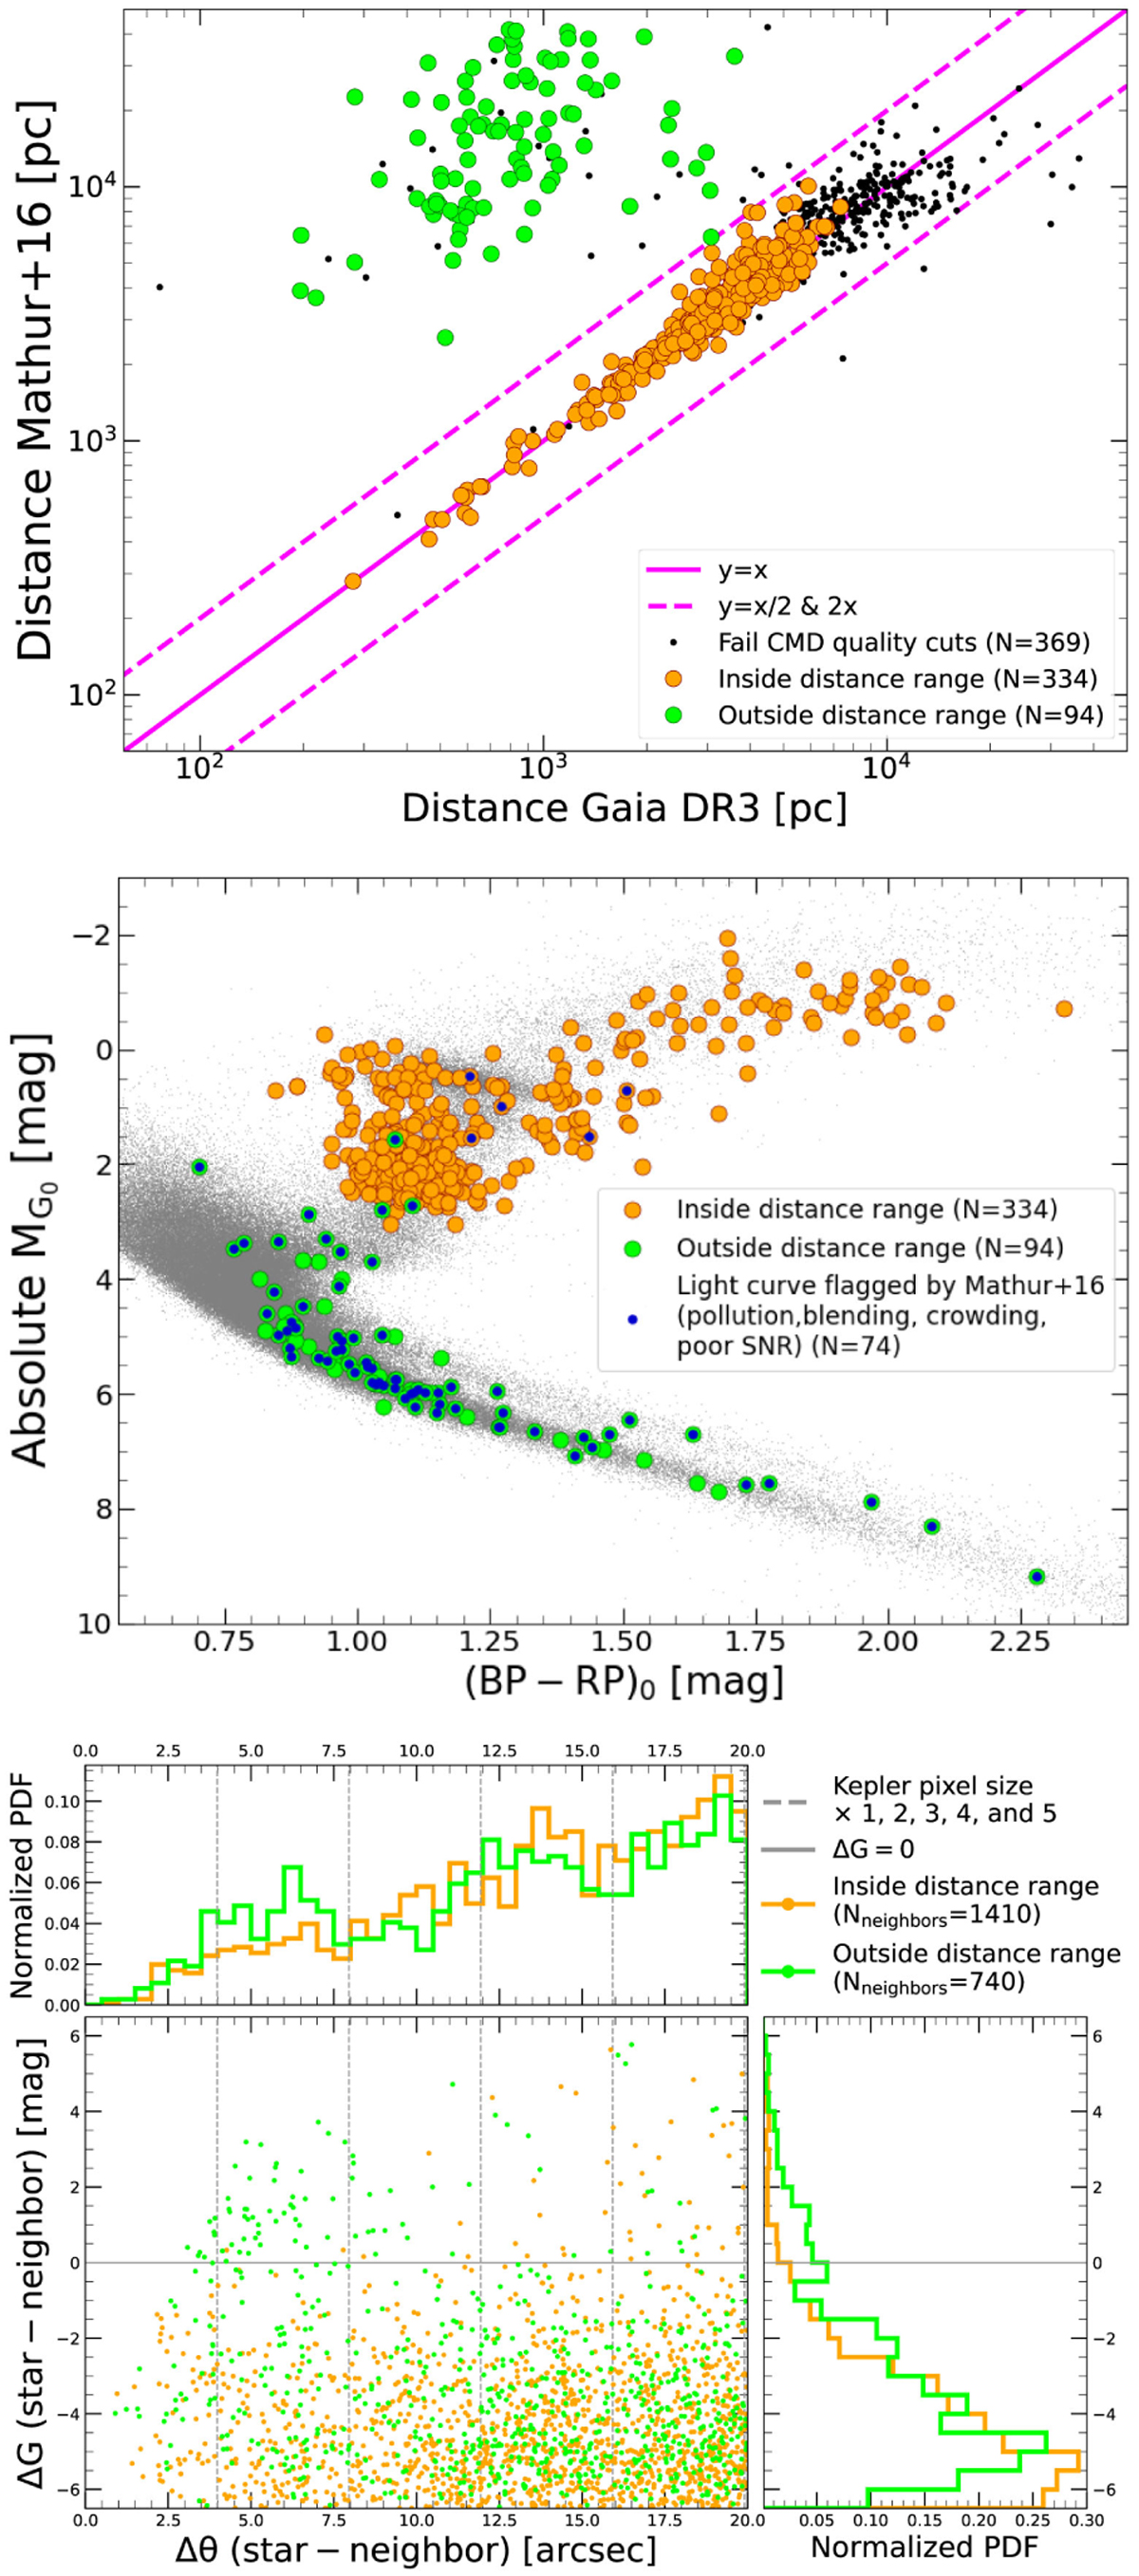
Fig. 9
Download original image
Gaia DR3 analysis of the misclassified stars identified by Mathur et al. (2016) from Sect. 6. Top: distance comparison. The sample was split between targets inside (orange) and outside (green) the 2:1 and 1:2 lines. Middle: Gaia CMD projection. The targets with large distance discrepancies (green) appear predominantly as MS stars in Gaia, and most of them have crowding or blending flags (overplotted blue) in Mathur et al. (2016). Bottom: ΔG vs. Δθ diagram (and marginalized distributions) of the stars’ neighborhoods. The targets outside the distance range have more bright nearby neighbors than the targets inside the distance range, and thus the former are more prone to having contaminated Kepler light curves than the latter.
Current usage metrics show cumulative count of Article Views (full-text article views including HTML views, PDF and ePub downloads, according to the available data) and Abstracts Views on Vision4Press platform.
Data correspond to usage on the plateform after 2015. The current usage metrics is available 48-96 hours after online publication and is updated daily on week days.
Initial download of the metrics may take a while.