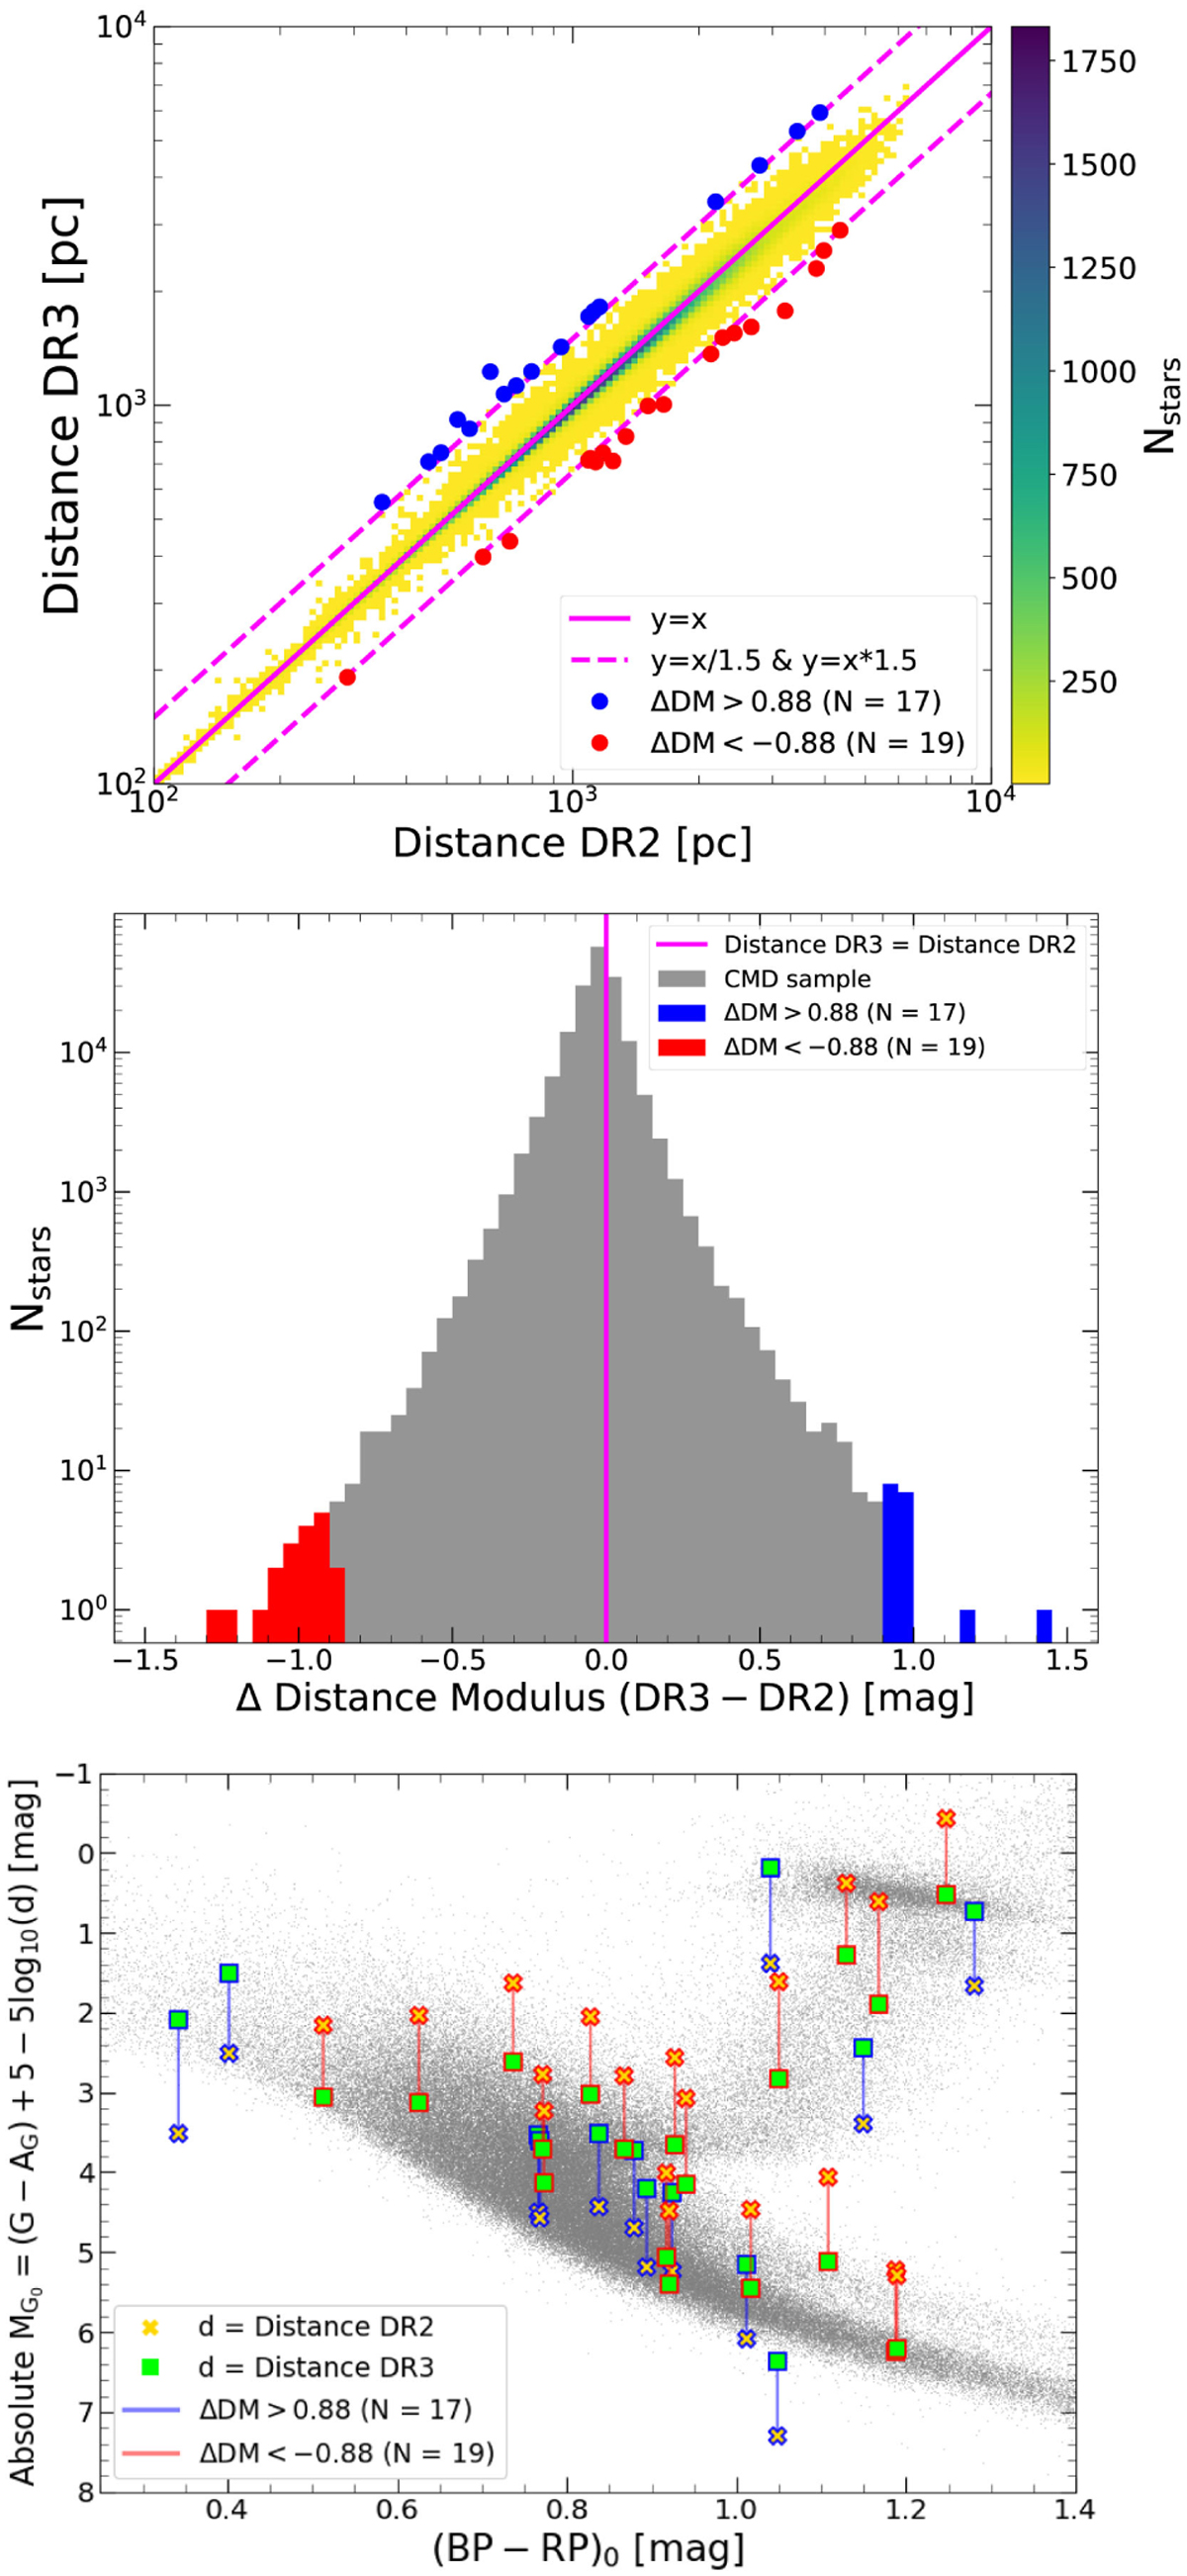
Fig. 8
Download original image
Astrometric comparison between Gaia DR3 and DR2 from Sect. 5. Top: 2D histogram of the distance comparison. Most targets closely follow the 1:1 relation. Middle: Distribution of the distance modulus difference (in the sense of DR3 minus DR2). Stars are heavily centered around ΔDM = 0, but outliers outside the 1.5:1 and 1:1.5 relations are selected for further inspection (blue and red samples). Bottom: CMD projection of the ΔDM outliers, with their DR3 and DR2 positions shown in the green squares and yellow crosses, respectively. The astrometric differences can drive important CMD changes, thus modifying the derived stellar properties.
Current usage metrics show cumulative count of Article Views (full-text article views including HTML views, PDF and ePub downloads, according to the available data) and Abstracts Views on Vision4Press platform.
Data correspond to usage on the plateform after 2015. The current usage metrics is available 48-96 hours after online publication and is updated daily on week days.
Initial download of the metrics may take a while.