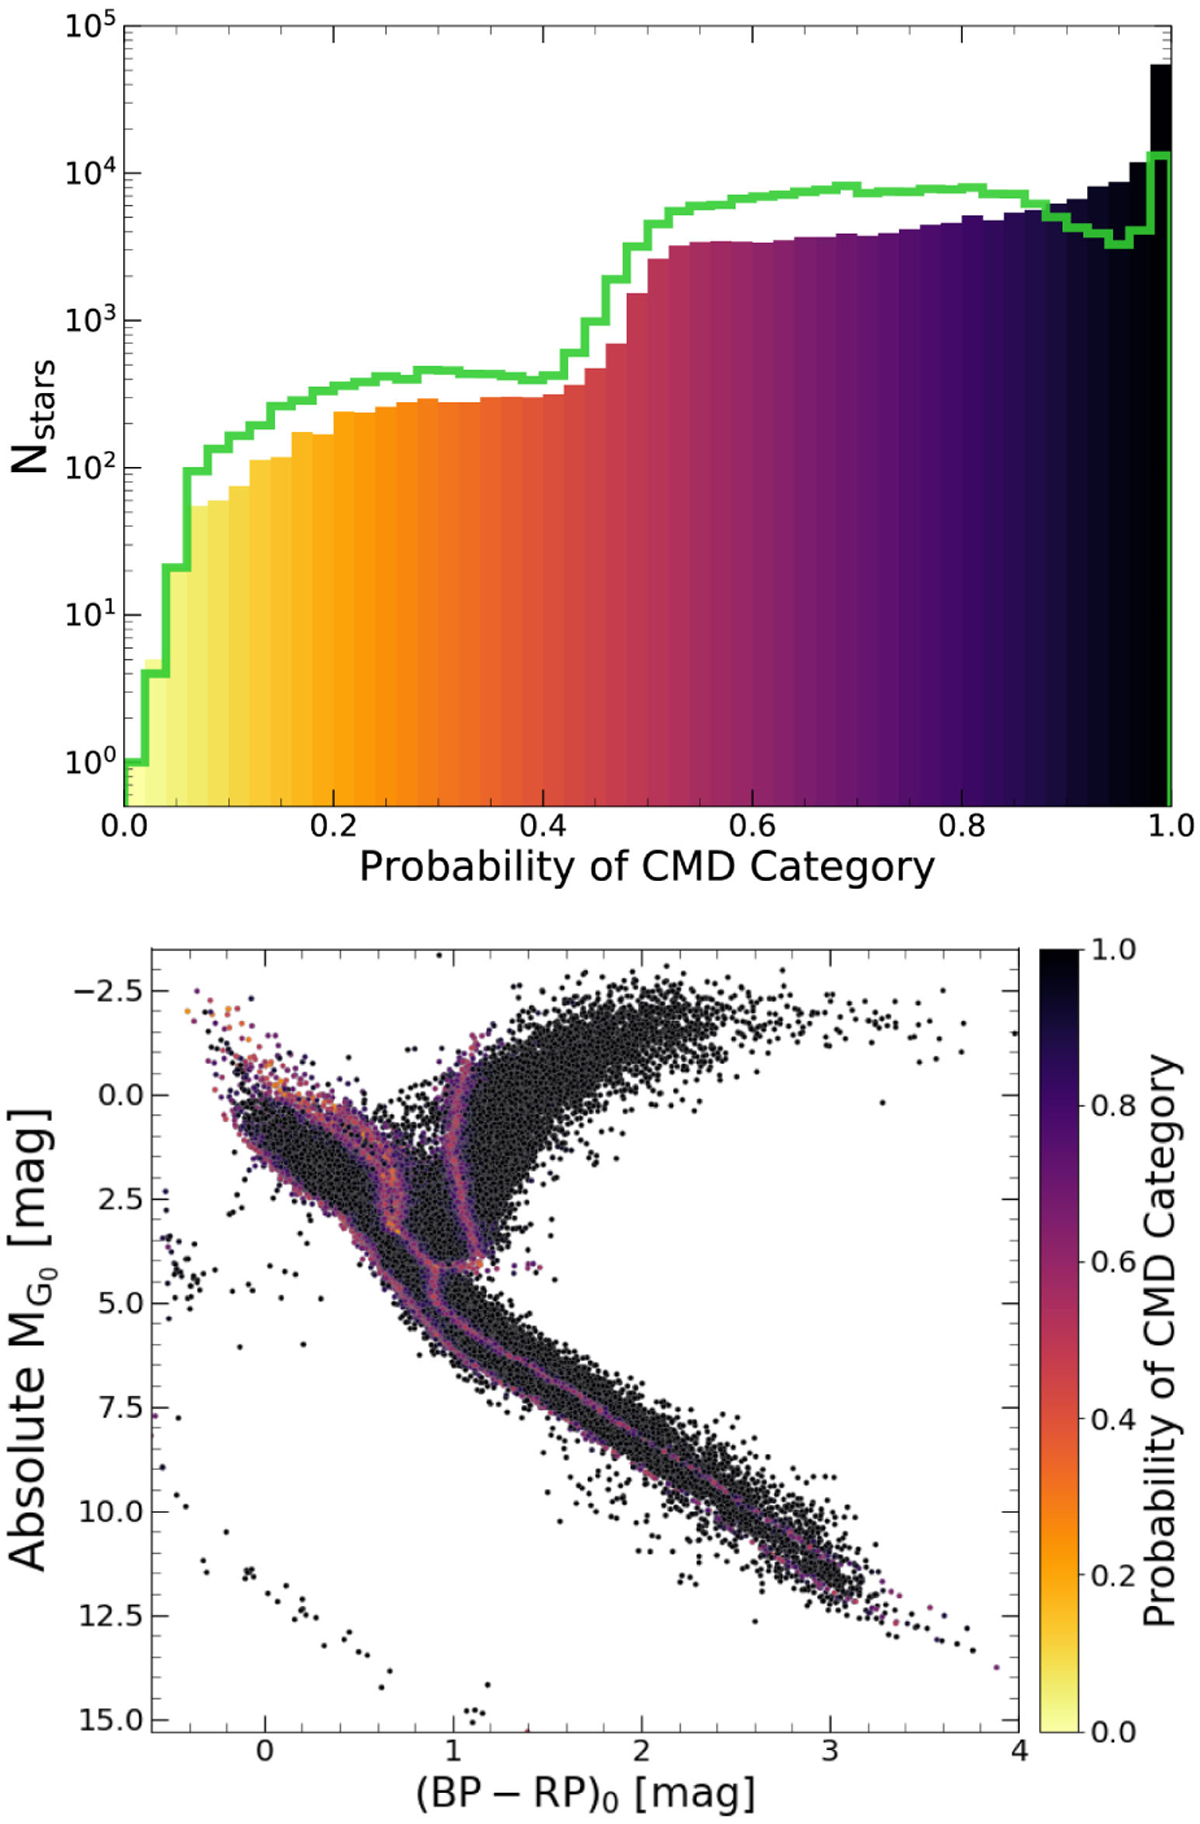
Fig. 4
Download original image
Validation of the CMD categories via the Monte Carlo method presented in Sect. 3.6. Top: Logarithmic distribution of the probability of CMD category parameter, PCMD. The filled histogram represents the fiducial simulation (Sect. 3.5.1), while the open histogram represents the simulation that includes metallicity effects (Sect. 3.5.2). Bottom: CMD projection color-coded by the fiducial PCMD values. Most of the stars have high PCMD values, indicating that their assigned CMD categories are reliable. Targets with low PCMD values are located near the boundaries of the CMD regions (see bottom panel of Figure 2), and their CMD categories are consequently less reliable.
Current usage metrics show cumulative count of Article Views (full-text article views including HTML views, PDF and ePub downloads, according to the available data) and Abstracts Views on Vision4Press platform.
Data correspond to usage on the plateform after 2015. The current usage metrics is available 48-96 hours after online publication and is updated daily on week days.
Initial download of the metrics may take a while.