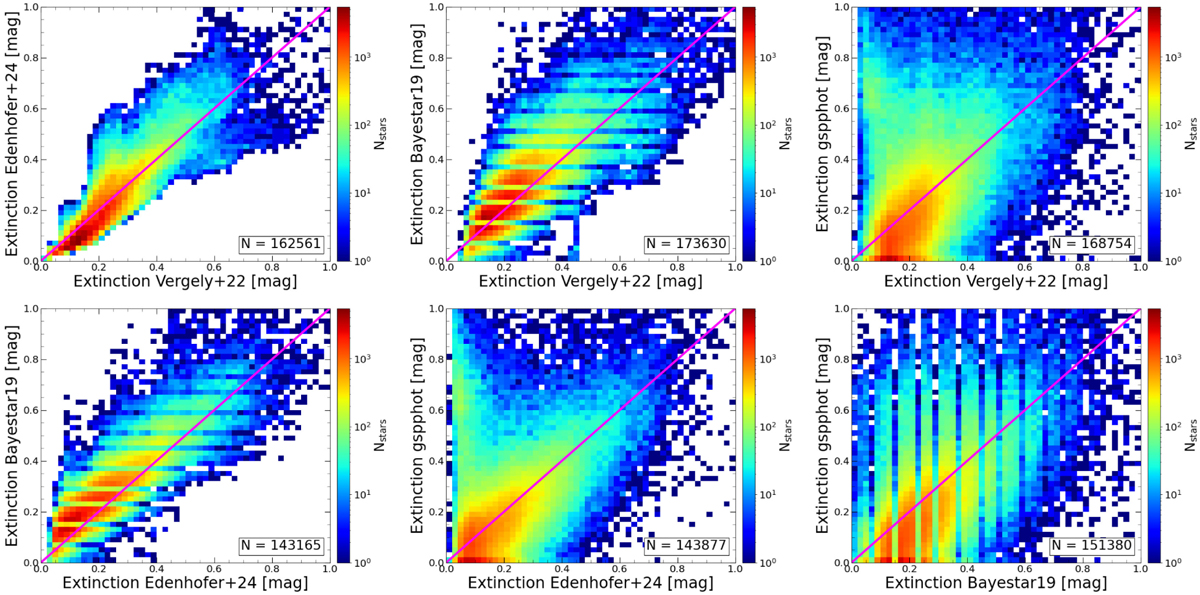
Fig. D.1
Download original image
Comparison of the different extinction references considered in this work: Vergely et al. (2022), Edenhofer et al. (2024), Bayestar19, and gspphot. Each panel shows a 2D histogram of the extinction comparison between two references. The color bars indicate logarithmic density (with the same range for all panels), and the 1:1 line is shown in magenta. The number of stars in each plot is indicated in the bottom-right corner. Given that the Bayestar19 values are reported to fewer decimal places than the other references, the panels involving this map display horizontal/vertical stripes. The gspphot extinctions show the largest disagreement of all the references. For the CMD analysis, we adopted the Vergely et al. (2022) map as the source of extinctions.
Current usage metrics show cumulative count of Article Views (full-text article views including HTML views, PDF and ePub downloads, according to the available data) and Abstracts Views on Vision4Press platform.
Data correspond to usage on the plateform after 2015. The current usage metrics is available 48-96 hours after online publication and is updated daily on week days.
Initial download of the metrics may take a while.