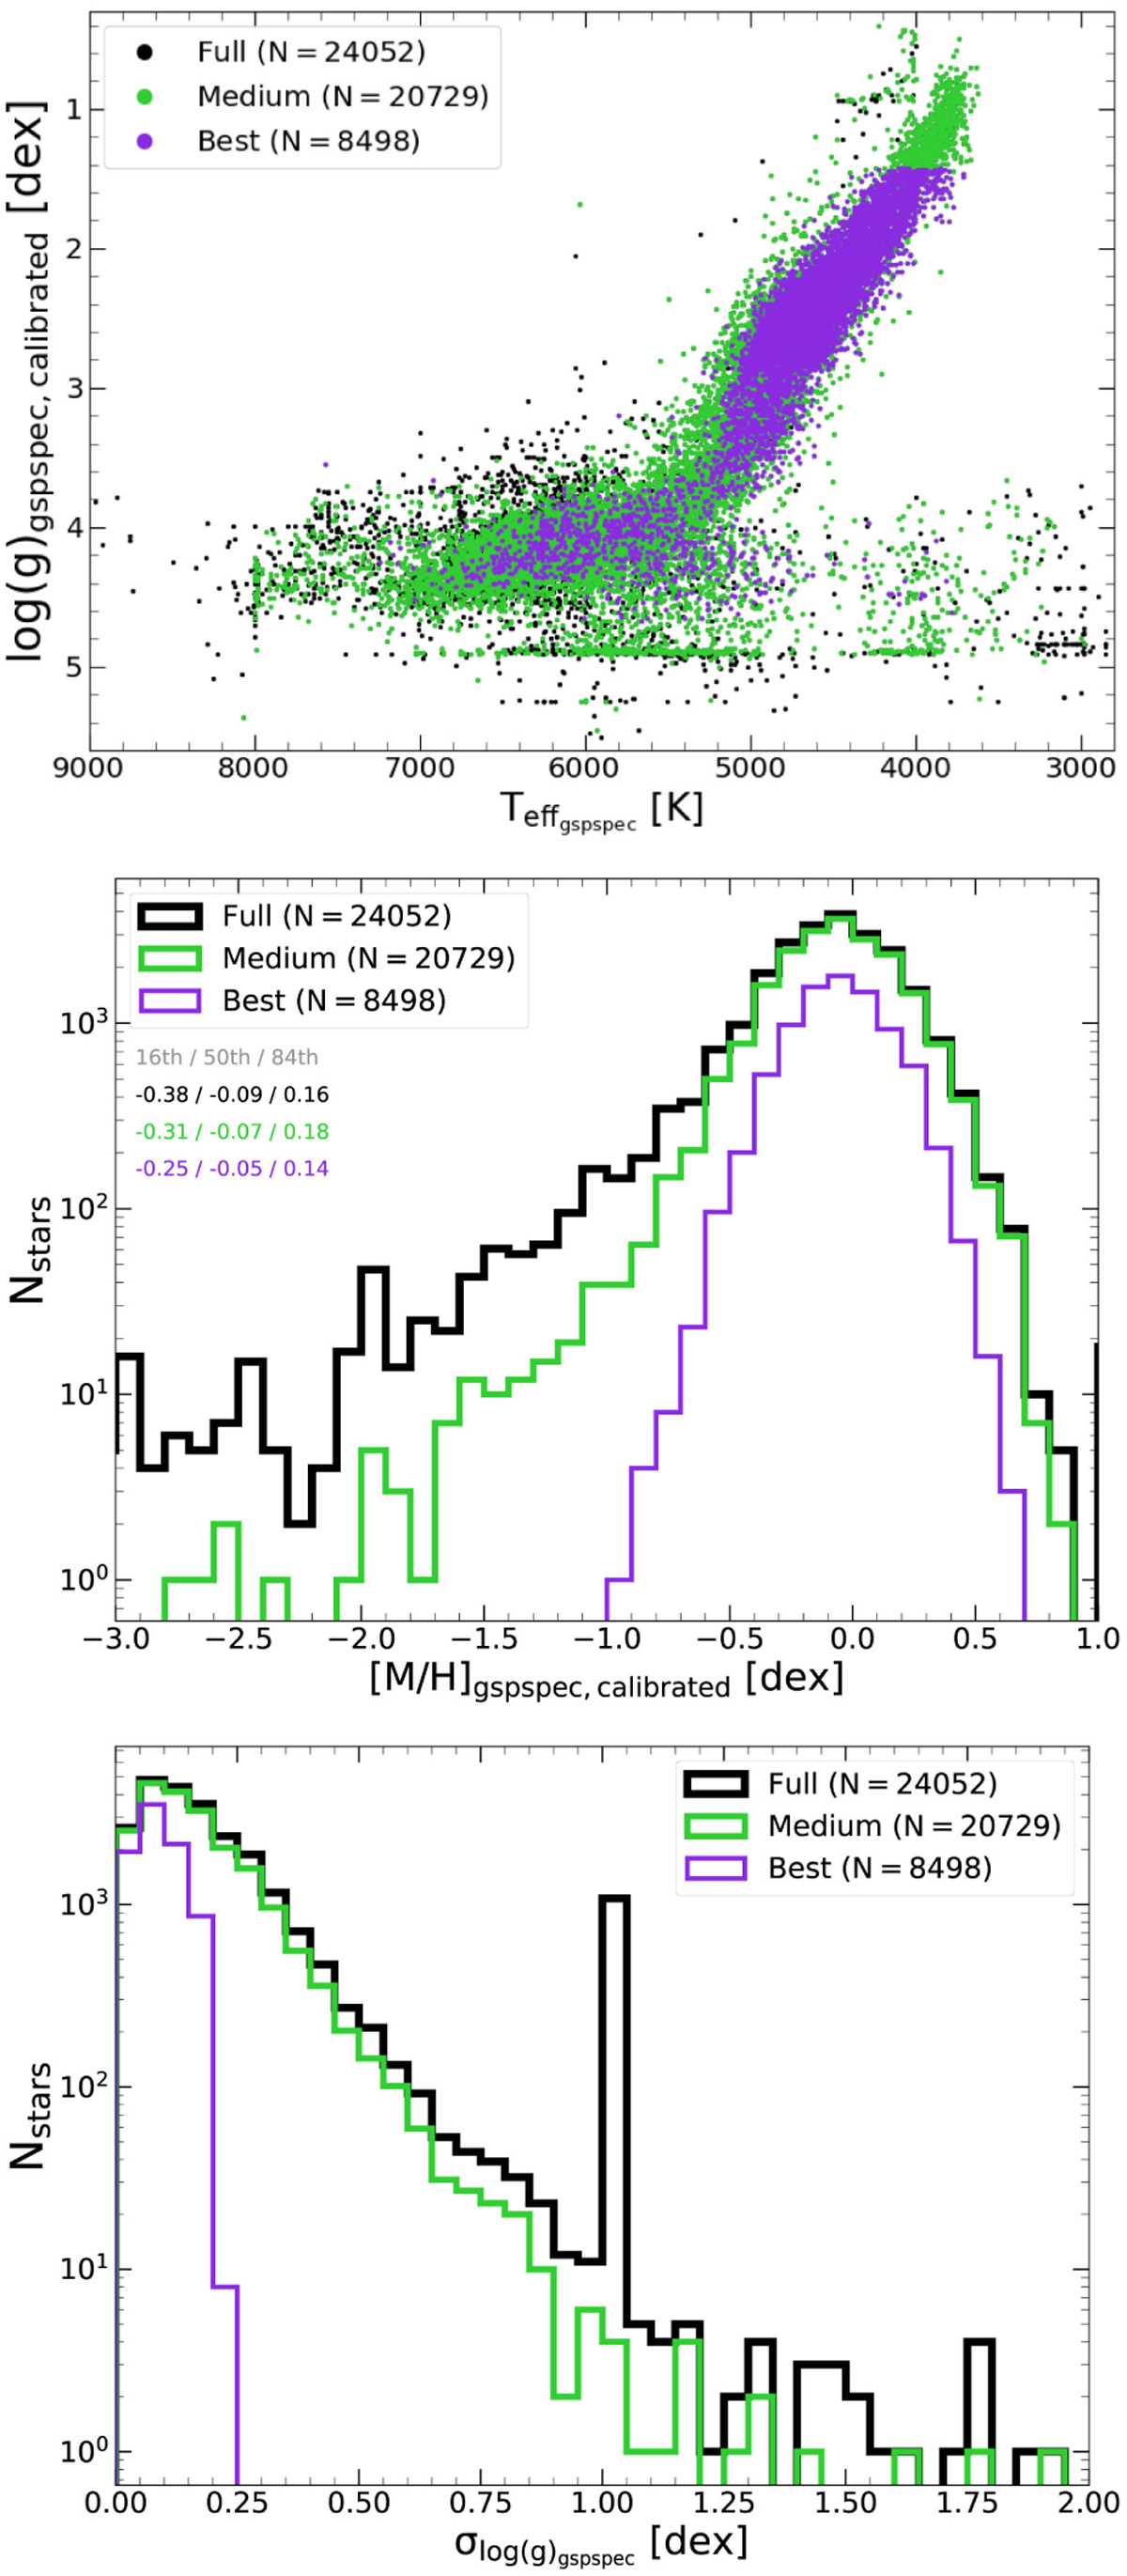
Fig. B.1
Download original image
Impact of quality flags on the gspspec parameters. The data sets shown are the full (black), medium-quality (green), and best-quality (purple) samples. Top: Kiel diagram. Artifacts were progressively removed for more stringent selections. Middle: Calibrated metallicity distribution. The 16th, 50th, and 84th percentiles of each sample are shown in the colored text. The metal-poor tail was more heavily affected by the flags. Bottom: Distribution of surface gravity uncertainties. Only targets with small uncertainties survived the most stringent quality cuts.
Current usage metrics show cumulative count of Article Views (full-text article views including HTML views, PDF and ePub downloads, according to the available data) and Abstracts Views on Vision4Press platform.
Data correspond to usage on the plateform after 2015. The current usage metrics is available 48-96 hours after online publication and is updated daily on week days.
Initial download of the metrics may take a while.