Fig. 10
Download original image
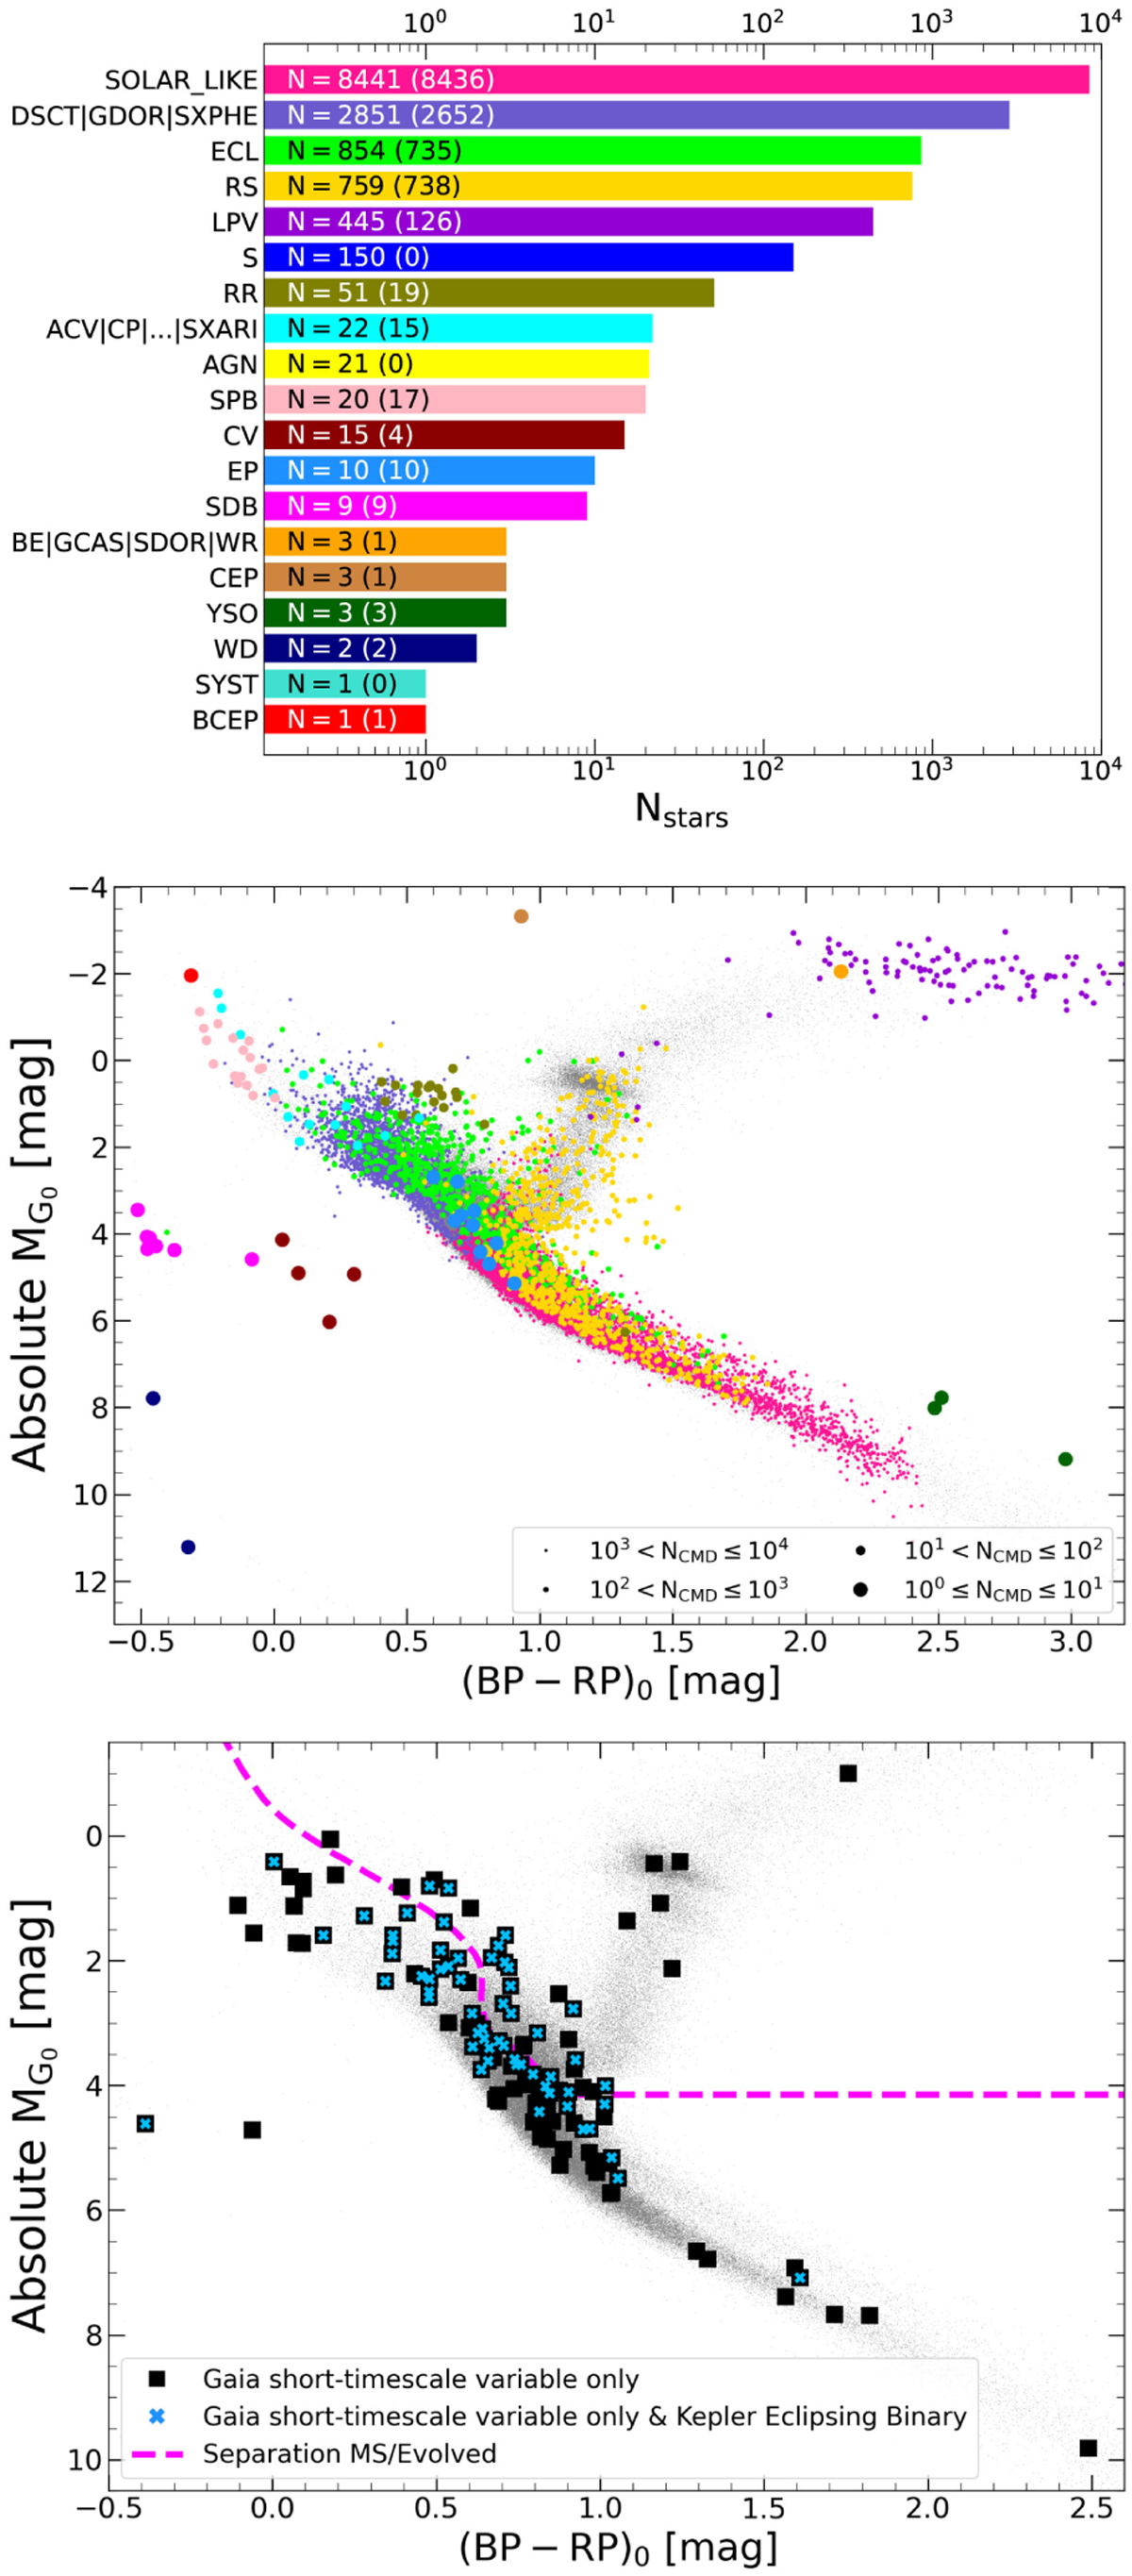
Photometric variability analysis of the Kepler targets from Sect. 7. Top: bar chart of the 19 classes of variable sources found in Gaia DR3. The text inside the bars lists the number of targets in each class (with the size of the CMD subset shown in parenthesis). Middle: CMD projection of the variable sources with classifications. Targets are color-coded following the bars in the top panel, and the symbol size increases for smaller samples. The full CMD sample (grey) is shown for reference in the background. The interpretations of the CMD locations are greatly benefited by the variability classifications in Gaia DR3. Bottom: CMD projection of the “Gaia short-timescale variable only” targets (black squares). A significant fraction of them were found to be Kepler eclipsing binaries (cyan crosses).
Current usage metrics show cumulative count of Article Views (full-text article views including HTML views, PDF and ePub downloads, according to the available data) and Abstracts Views on Vision4Press platform.
Data correspond to usage on the plateform after 2015. The current usage metrics is available 48-96 hours after online publication and is updated daily on week days.
Initial download of the metrics may take a while.