Fig. 1
Download original image
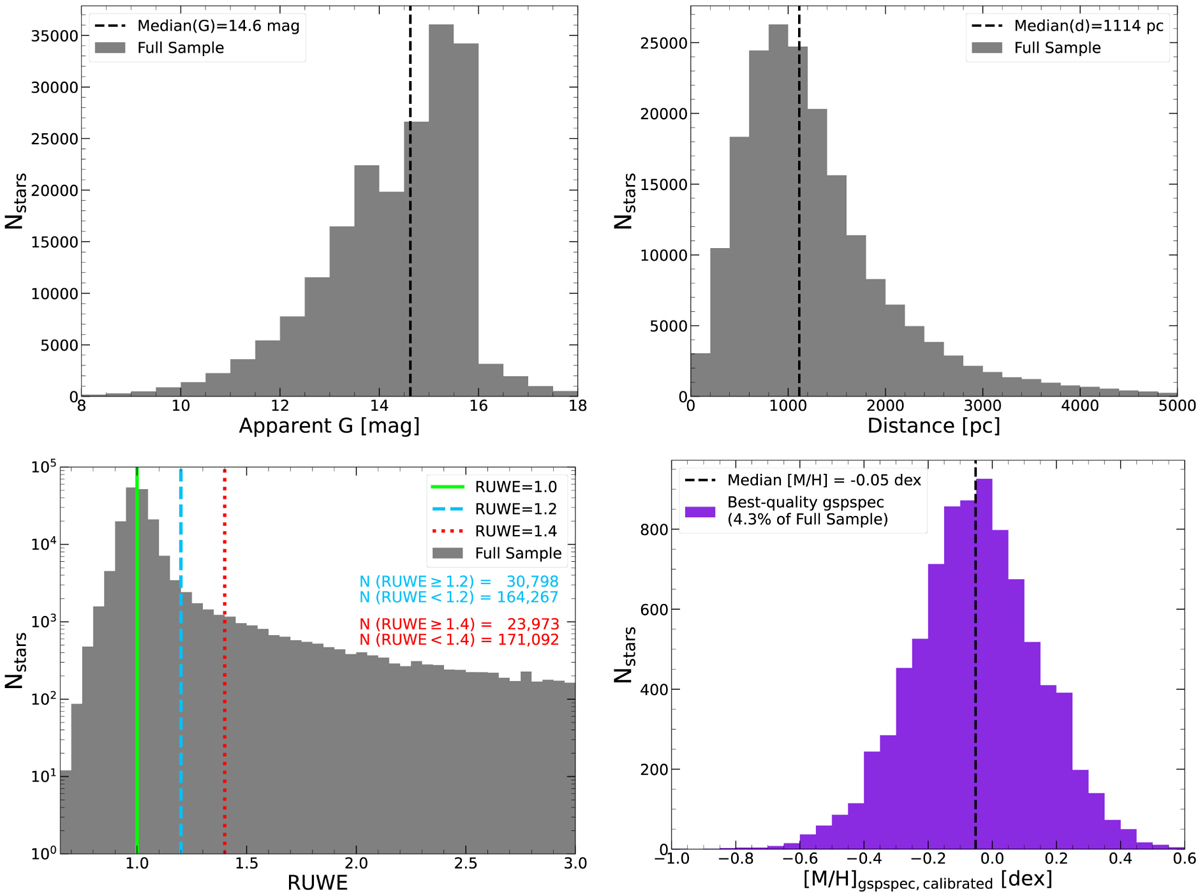
Characterization of the Kepler targets. Top-left: distribution of apparent Gaia G-band magnitudes. The targets are mostly concentrated in the 10 < G < 16 mag range. Top-right: distribution of Gaia distances. The distribution peaks around ~1 kpc. Bottom-left: distribution of RUWE values, with the vertical lines indicating RUWE = 1.0 (green), 1.2 (cyan), and 1.4 (red). From this, RUWE binaries are later identified in Sect. 4. Bottom-right: distribution of calibrated metallicity values, for the subsample with best-quality gspspec data. The distribution peaks around [M/H] = 0 dex, in agreement with the literature.
Current usage metrics show cumulative count of Article Views (full-text article views including HTML views, PDF and ePub downloads, according to the available data) and Abstracts Views on Vision4Press platform.
Data correspond to usage on the plateform after 2015. The current usage metrics is available 48-96 hours after online publication and is updated daily on week days.
Initial download of the metrics may take a while.