Fig. 8
Download original image
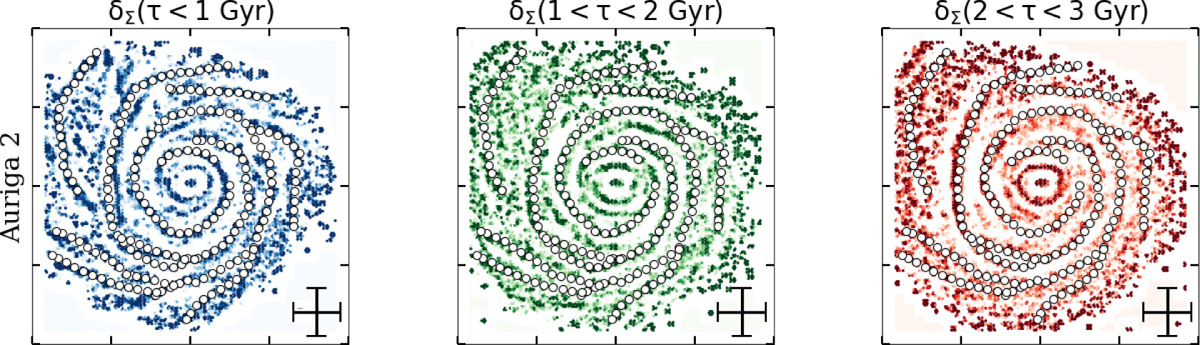
Density contrast maps of the AURIGA 2 simulation for three distinct age intervals: stellar particles younger than 1 Gyr (left column), those aged between 1 and 2 Gyr (middle column), and those between 2 and 3 Gyr (right column). Open circles indicate the spiral arm tracks inferred from Fig. 3. Cross in the bottom-right corner indicates the scale of ±5 kpc.
Current usage metrics show cumulative count of Article Views (full-text article views including HTML views, PDF and ePub downloads, according to the available data) and Abstracts Views on Vision4Press platform.
Data correspond to usage on the plateform after 2015. The current usage metrics is available 48-96 hours after online publication and is updated daily on week days.
Initial download of the metrics may take a while.