Fig. 6
Download original image
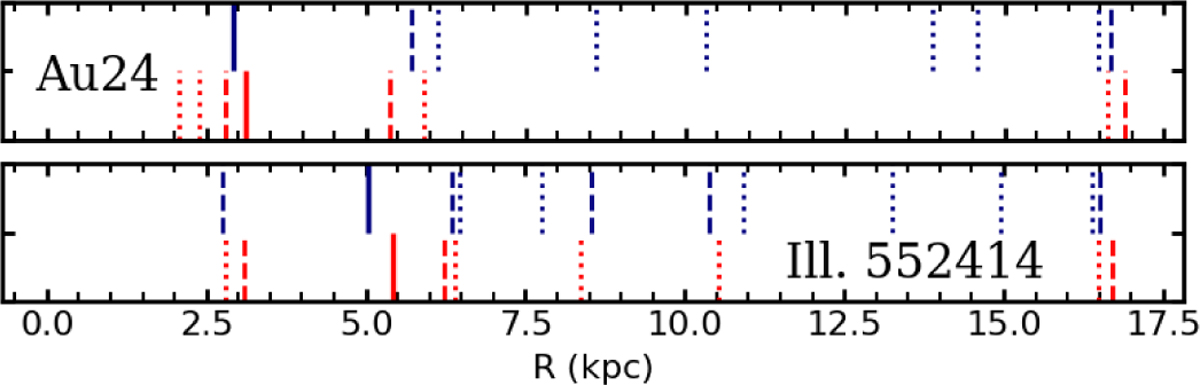
Location of the resonances created by the m = 2 and the m = 4 perturbers in the AURIGA 24 and ILLUSTRIS 552414 simulations. Blue (red) vertical lines refer to the m = 2 (m = 4) perturber; while the linestyle denotes the frequency ratio involved: corotation (solid lines), first harmonics 2 : 1b and 4 : 1s (dashed lines), second harmonics 1 : 1b and 2 : 1s (dotted lines).
Current usage metrics show cumulative count of Article Views (full-text article views including HTML views, PDF and ePub downloads, according to the available data) and Abstracts Views on Vision4Press platform.
Data correspond to usage on the plateform after 2015. The current usage metrics is available 48-96 hours after online publication and is updated daily on week days.
Initial download of the metrics may take a while.