Fig. 3
Download original image
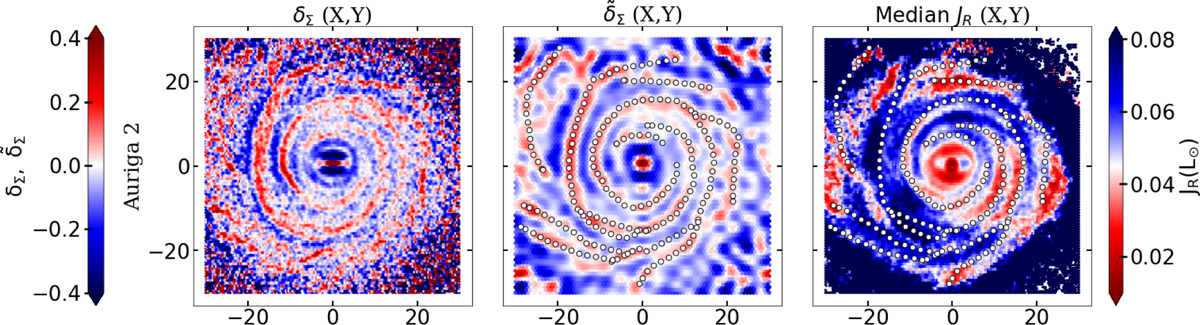
Maps of the density contrast (first column), its bidimensional Fourier approximation (second column), and mass-weighted median radial action (third column) for the AURIGA 2 simulation. Open circles in second and third panels denote the inferred tracks for the spiral arms. The corresponding maps for the rest of simulations considered in this work can be found in Figs. B.1–B.4.
Current usage metrics show cumulative count of Article Views (full-text article views including HTML views, PDF and ePub downloads, according to the available data) and Abstracts Views on Vision4Press platform.
Data correspond to usage on the plateform after 2015. The current usage metrics is available 48-96 hours after online publication and is updated daily on week days.
Initial download of the metrics may take a while.