Fig. 2
Download original image
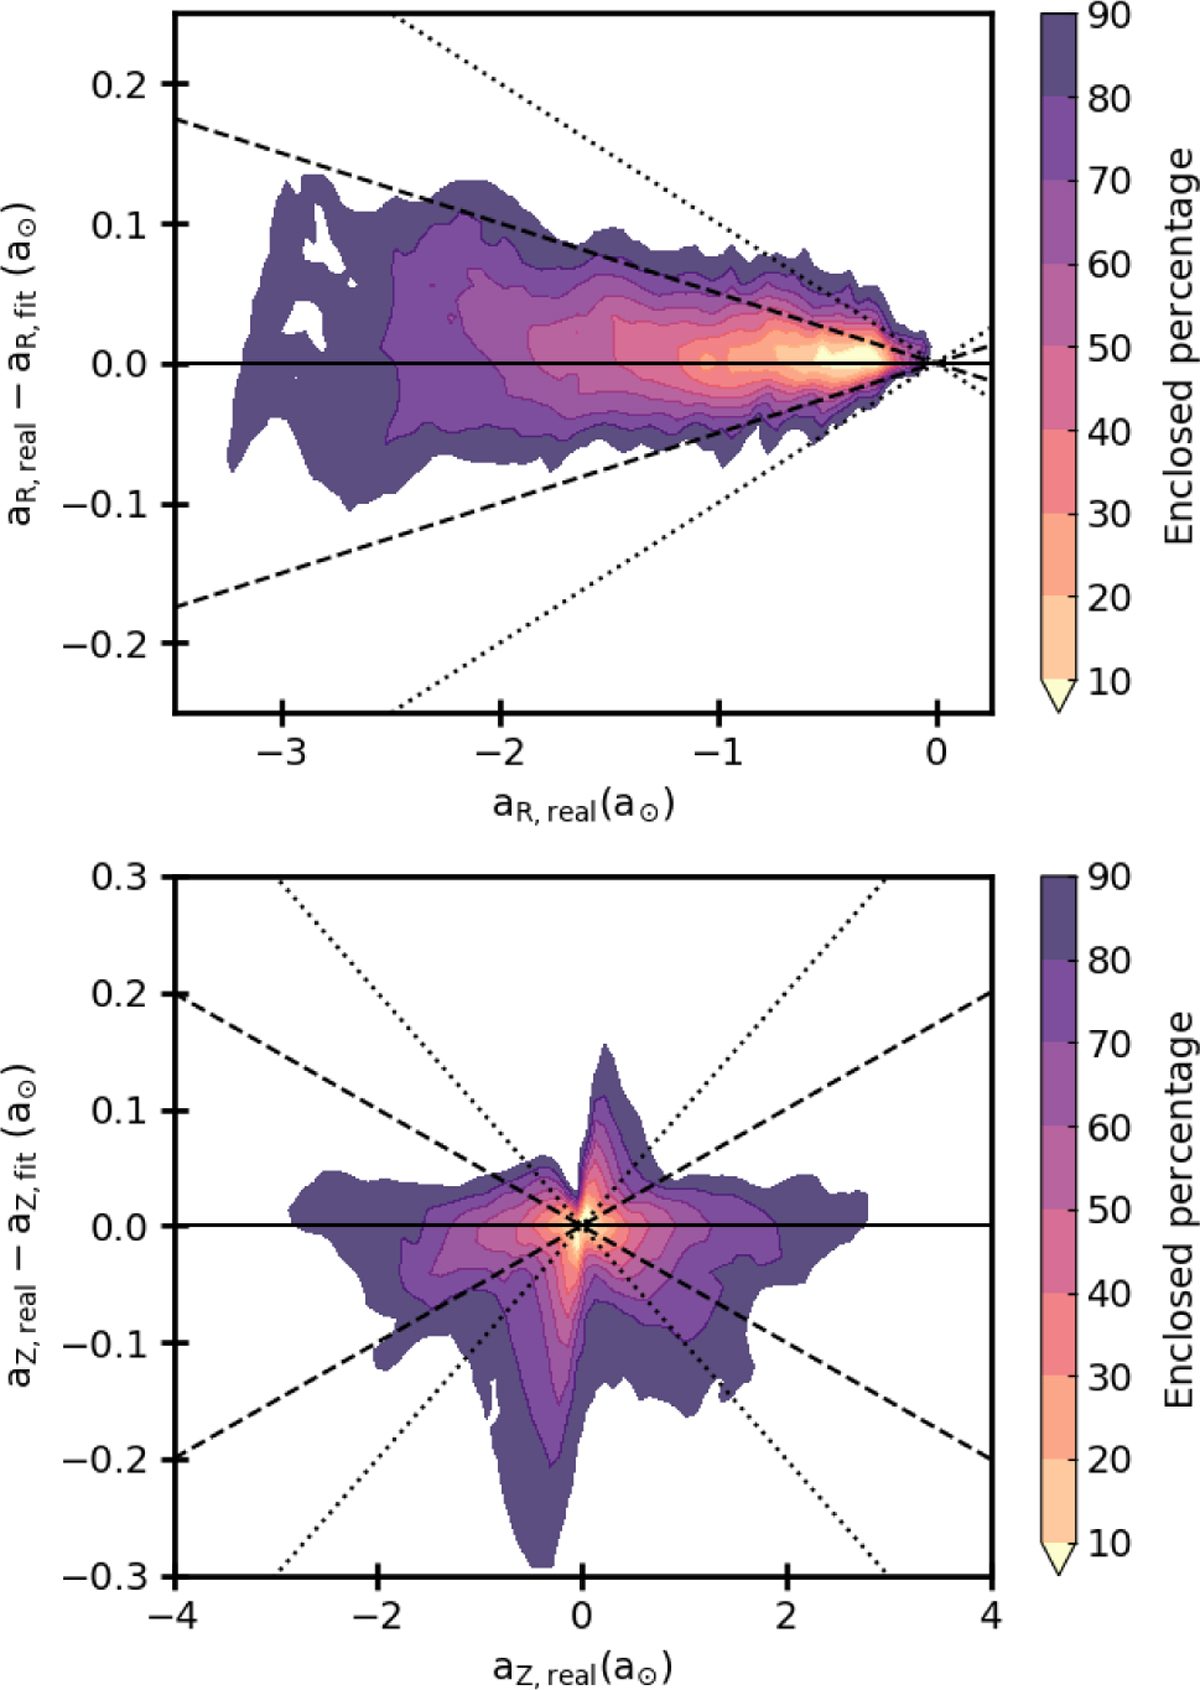
Model of the accelerations of the NewHorizon simulation. Upper (lower) panel: discrepancy between the reported radial (vertical) acceleration and its fit as a function of the acceleration itself. The colour-bars indicate the percentage of stellar particles enclosed in each region. Dashed (dotted) lines represent relative errors of ±5% (±10%). All the accelerations are expressed in units of a⊙ ≈ 6895.6 km2 s−2 kpc−1.
Current usage metrics show cumulative count of Article Views (full-text article views including HTML views, PDF and ePub downloads, according to the available data) and Abstracts Views on Vision4Press platform.
Data correspond to usage on the plateform after 2015. The current usage metrics is available 48-96 hours after online publication and is updated daily on week days.
Initial download of the metrics may take a while.