Fig. 6
Download original image
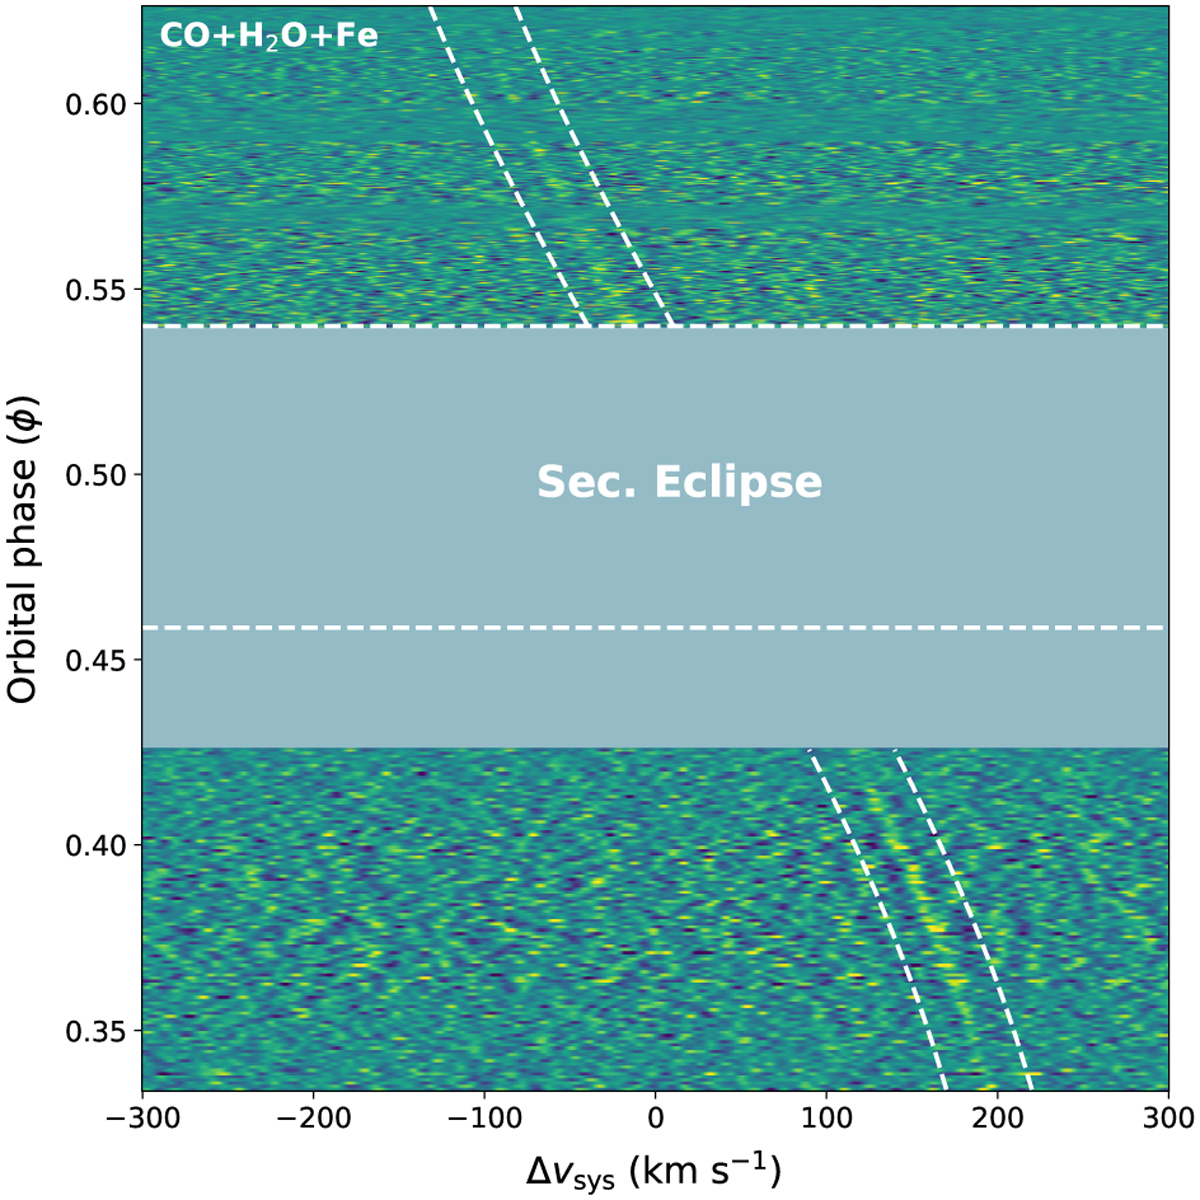
Cross-correlation map for CO+H2O+Fe model, tracing out the planet signal throughout the observed phases. The dashed lines on either side of the CCF trail show the expected planet radial velocity (offset by ±25 km s−1), and the horizontal dashed lines indicate the secondary eclipse. The grey space between the end of our pre-eclipse observations and the start of the eclipse denotes phases at which no data were taken.
Current usage metrics show cumulative count of Article Views (full-text article views including HTML views, PDF and ePub downloads, according to the available data) and Abstracts Views on Vision4Press platform.
Data correspond to usage on the plateform after 2015. The current usage metrics is available 48-96 hours after online publication and is updated daily on week days.
Initial download of the metrics may take a while.