Fig. 5
Download original image
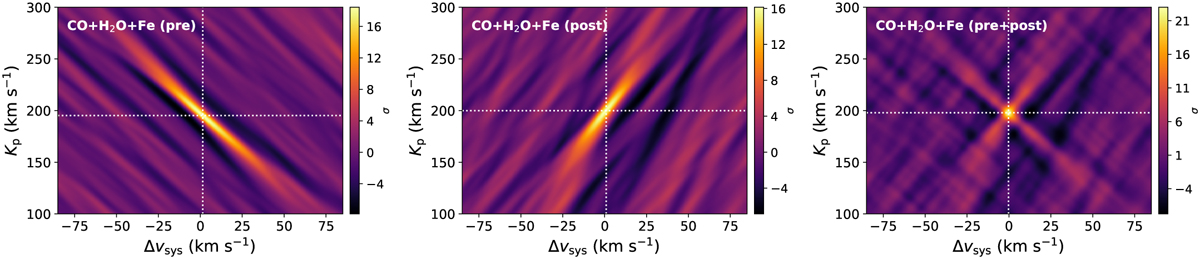
Kp–Δυsys maps of the combined CO, H2O and Fe detection in the atmosphere of MASCARA-1b for the pre-, post- and pre+post eclipse datasets. The atmospheric model used for the cross-correlation has combined contributions from the species and a thermal inversion as discussed in Sect. 3.1. The white dotted lines mark the detection peak, and the colour bar shows the detection significance computed from maps. The corresponding alpha detection significance and the conditional likelihood distribution of α are plotted in Fig. 4.
Current usage metrics show cumulative count of Article Views (full-text article views including HTML views, PDF and ePub downloads, according to the available data) and Abstracts Views on Vision4Press platform.
Data correspond to usage on the plateform after 2015. The current usage metrics is available 48-96 hours after online publication and is updated daily on week days.
Initial download of the metrics may take a while.