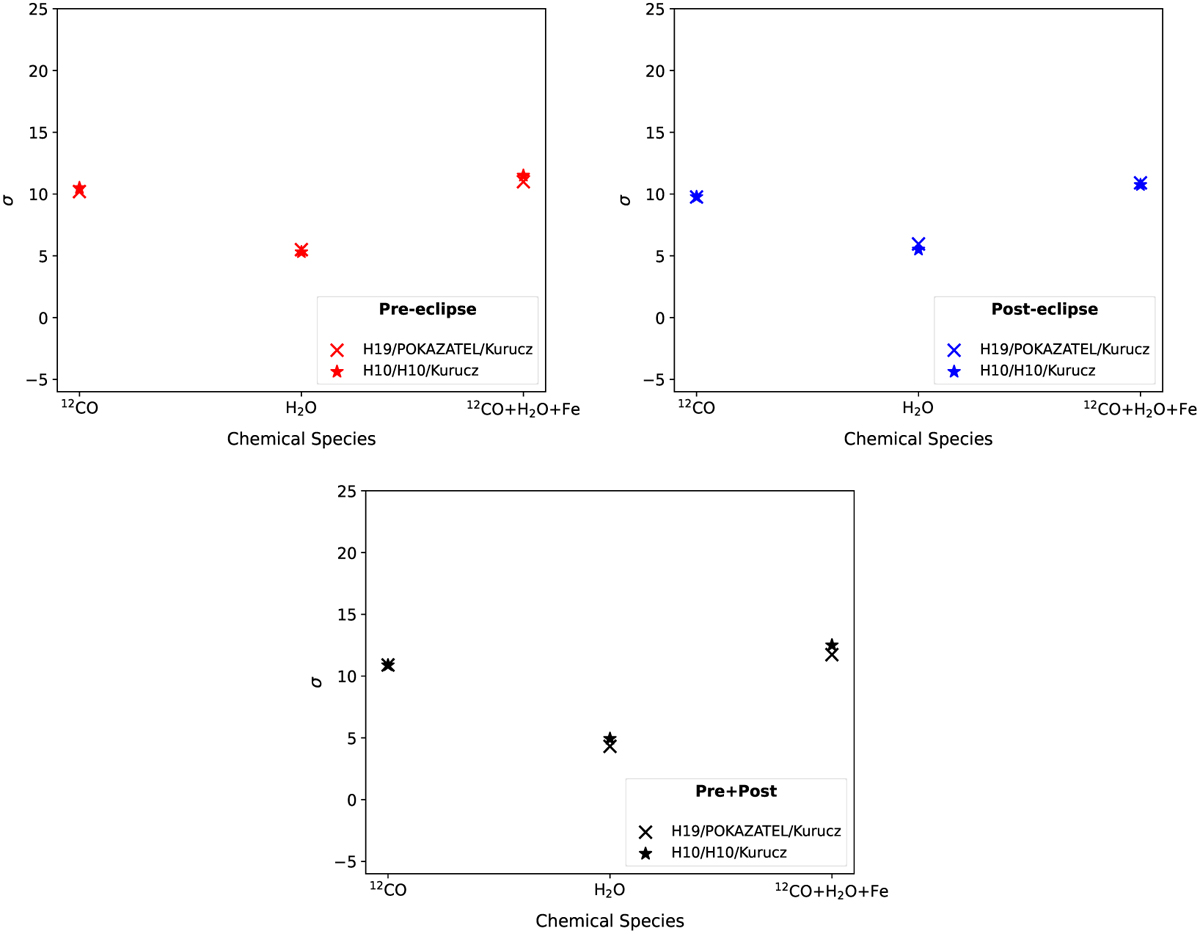
Fig. J.1
Download original image
Plot of alpha detection significance computed from the conditional likelihood distribution (detailed in Sects. 3.3 and 4) using different line lists (see Sect. 5.3) shown for the pre-eclipse, post-eclipse and pre+post datasets. The labels ‘H10’ and ‘H19’ correspond to the HITEMP 2010 and HITEMP 2019 line lists, respectively.
Current usage metrics show cumulative count of Article Views (full-text article views including HTML views, PDF and ePub downloads, according to the available data) and Abstracts Views on Vision4Press platform.
Data correspond to usage on the plateform after 2015. The current usage metrics is available 48-96 hours after online publication and is updated daily on week days.
Initial download of the metrics may take a while.