Fig. I.2
Download original image
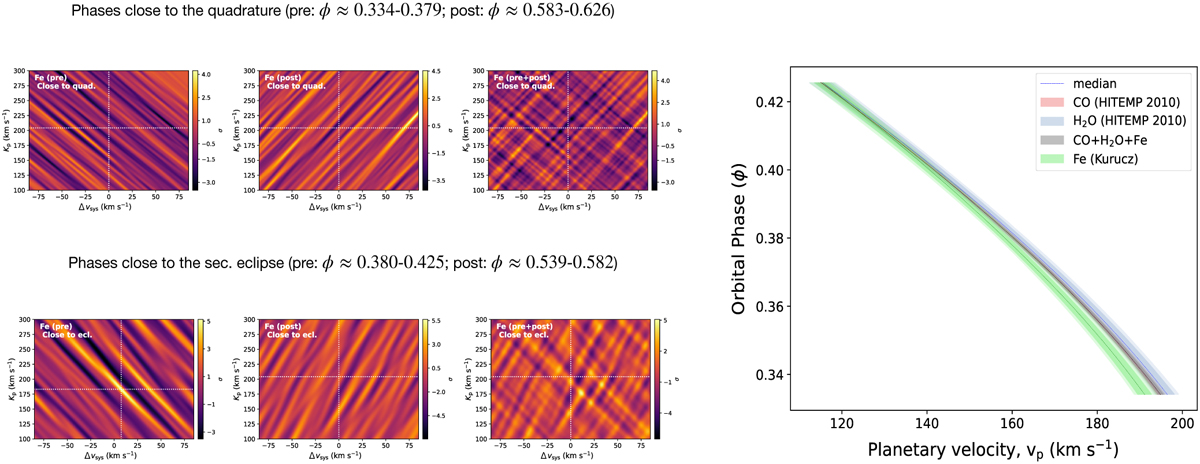
Left: Kp−Δυsys maps for the iron signal using the phase-dependent retrieval setup. Right: The retrieved planetary orbital velocity (υp) of the detected species for the pre-eclipse data alone, computed from 10,000 random samples of the MCMC. The dashed lines show the median value, and the shaded regions show the 1σ and 2σ contours (see Sect. 5.3).
Current usage metrics show cumulative count of Article Views (full-text article views including HTML views, PDF and ePub downloads, according to the available data) and Abstracts Views on Vision4Press platform.
Data correspond to usage on the plateform after 2015. The current usage metrics is available 48-96 hours after online publication and is updated daily on week days.
Initial download of the metrics may take a while.