Fig. G.1
Download original image
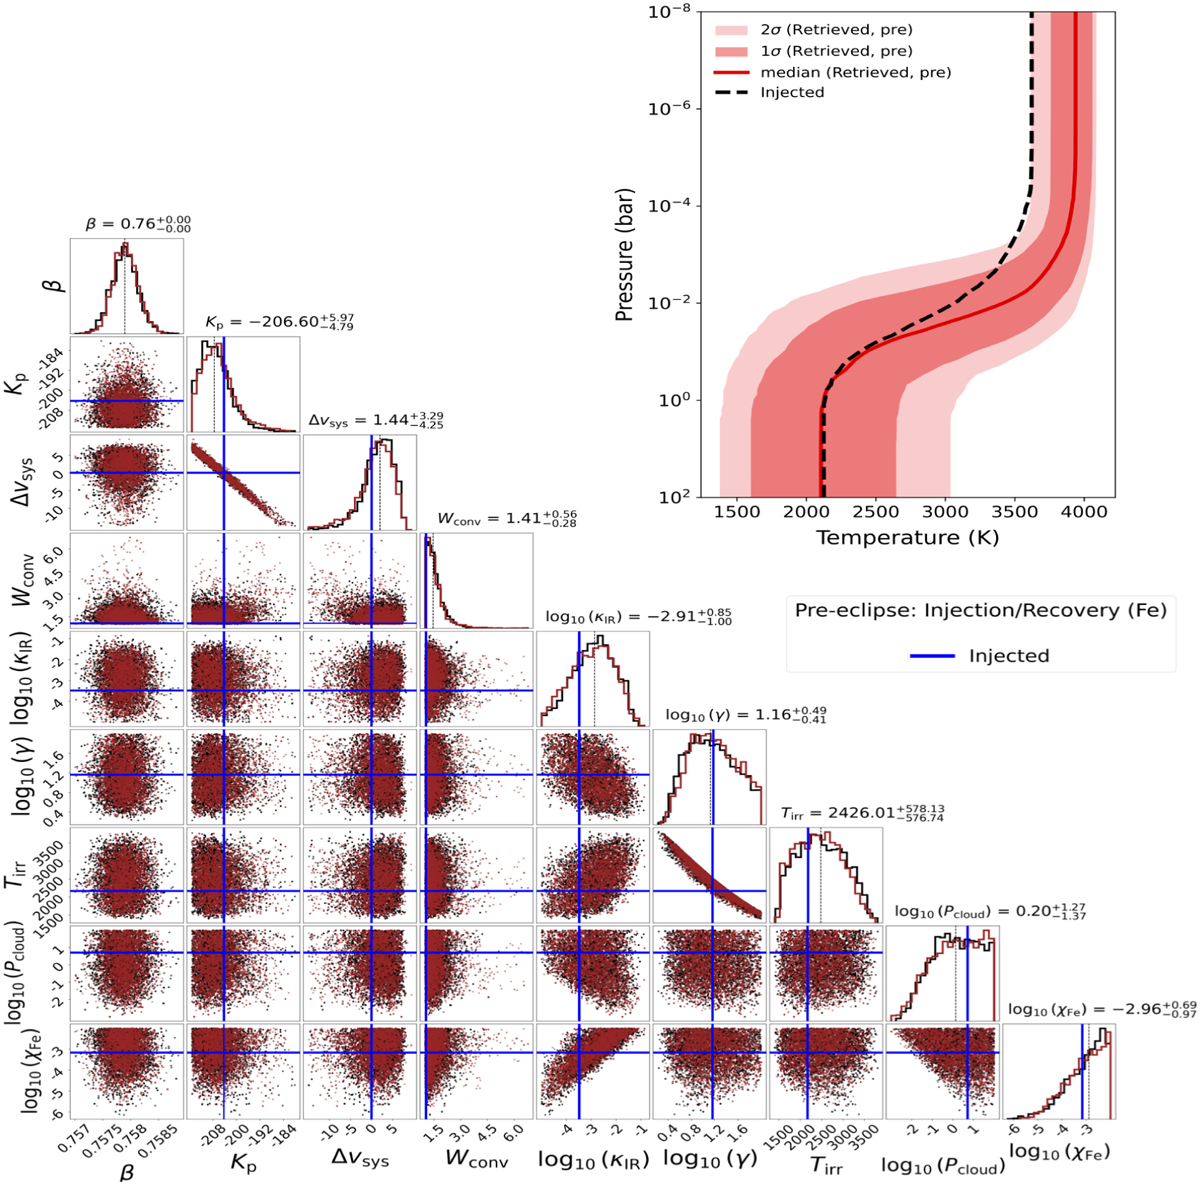
Results of the injection and recovery test for the pre-eclipse Fe (Sect. 5.2). The red and black posterior distributions represent independent sub-chains of the same MCMC chain, both converging to similar distributions. Upper right: the retrieved T–P profile computed from 10,000 random samples of the MCMC; the solid red curve shows the median profile and the shaded regions show the 1σ and 2σ contours. The dashed black curve shows the injected T–P profile.
Current usage metrics show cumulative count of Article Views (full-text article views including HTML views, PDF and ePub downloads, according to the available data) and Abstracts Views on Vision4Press platform.
Data correspond to usage on the plateform after 2015. The current usage metrics is available 48-96 hours after online publication and is updated daily on week days.
Initial download of the metrics may take a while.