Fig. C.1
Download original image
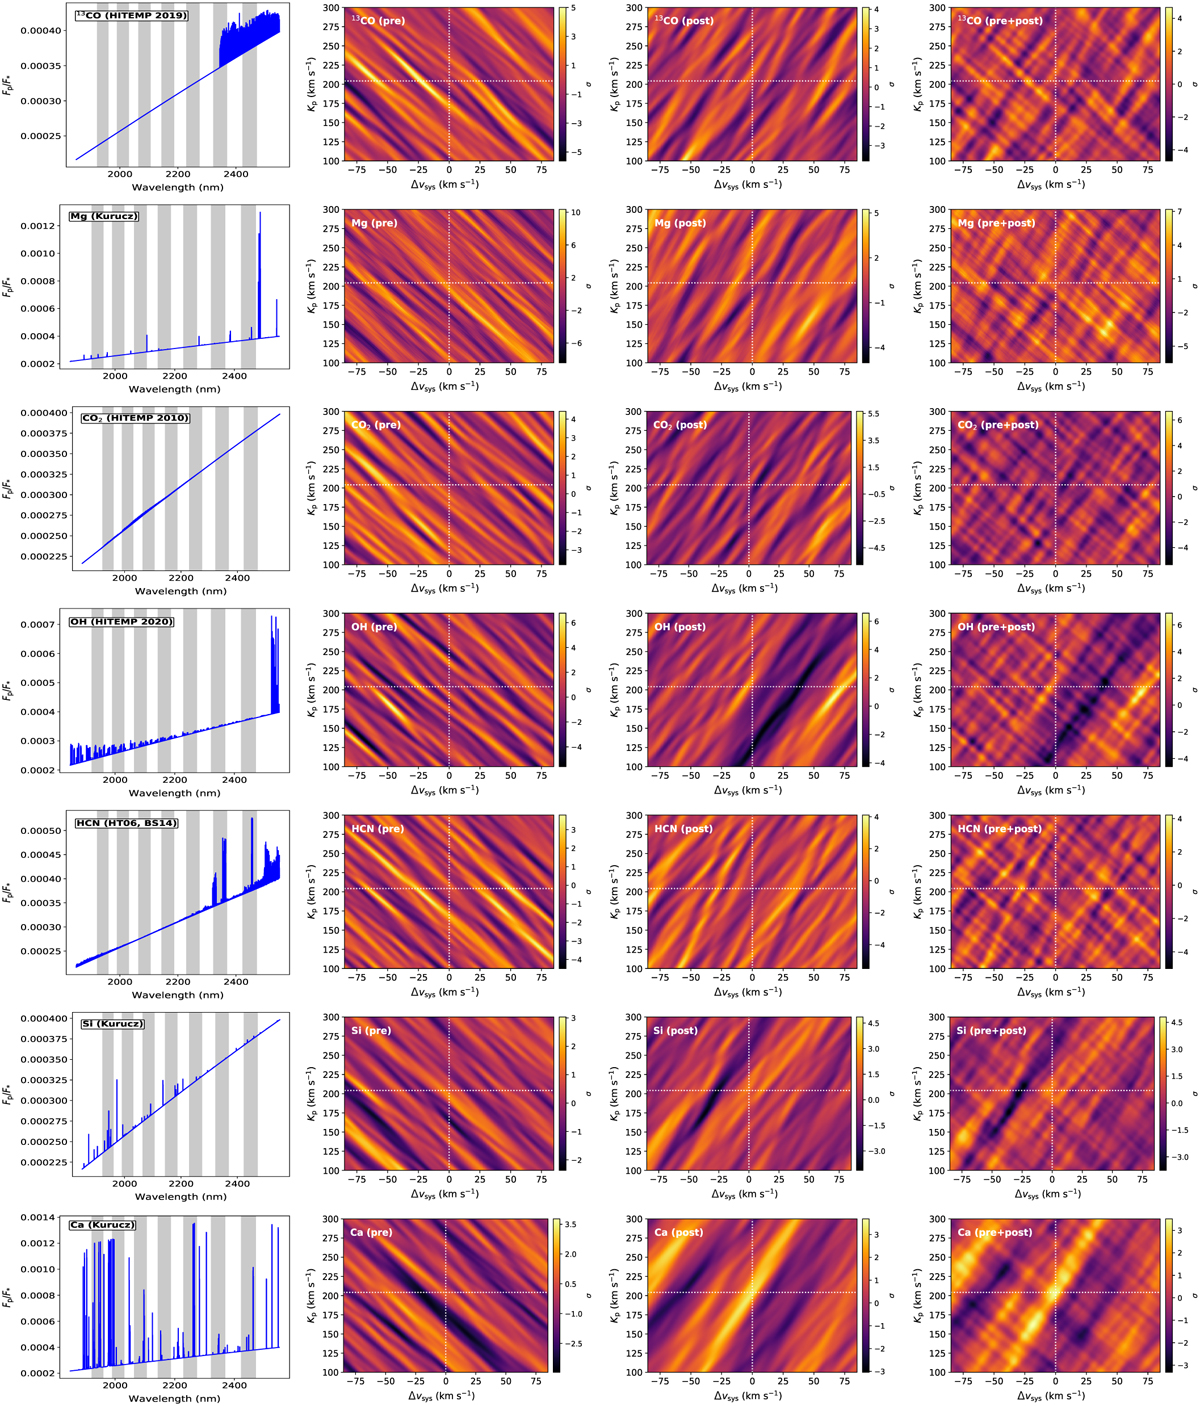
Kp−Δυsγs maps for the non-detected species. Left panels: emission model of each species with the wavelengths covered by CRIRES+ K2166 setting used in this work shown as vertical grey bands. Middle and right panels: the detection maps for the pre-ecl., post-ecl., and combined nights of the CRIRES+ data (Sect. 3.4). The high-resolution opacities were obtained from the following sources: 13CO, CO2 and OH from the HITEMP line list (Rothman et al. 2010), metal opacities from (Kurucz 2018) and HCN opacities from ExoMol database (Harris et al. 2006; Barber et al. 2014).
Current usage metrics show cumulative count of Article Views (full-text article views including HTML views, PDF and ePub downloads, according to the available data) and Abstracts Views on Vision4Press platform.
Data correspond to usage on the plateform after 2015. The current usage metrics is available 48-96 hours after online publication and is updated daily on week days.
Initial download of the metrics may take a while.