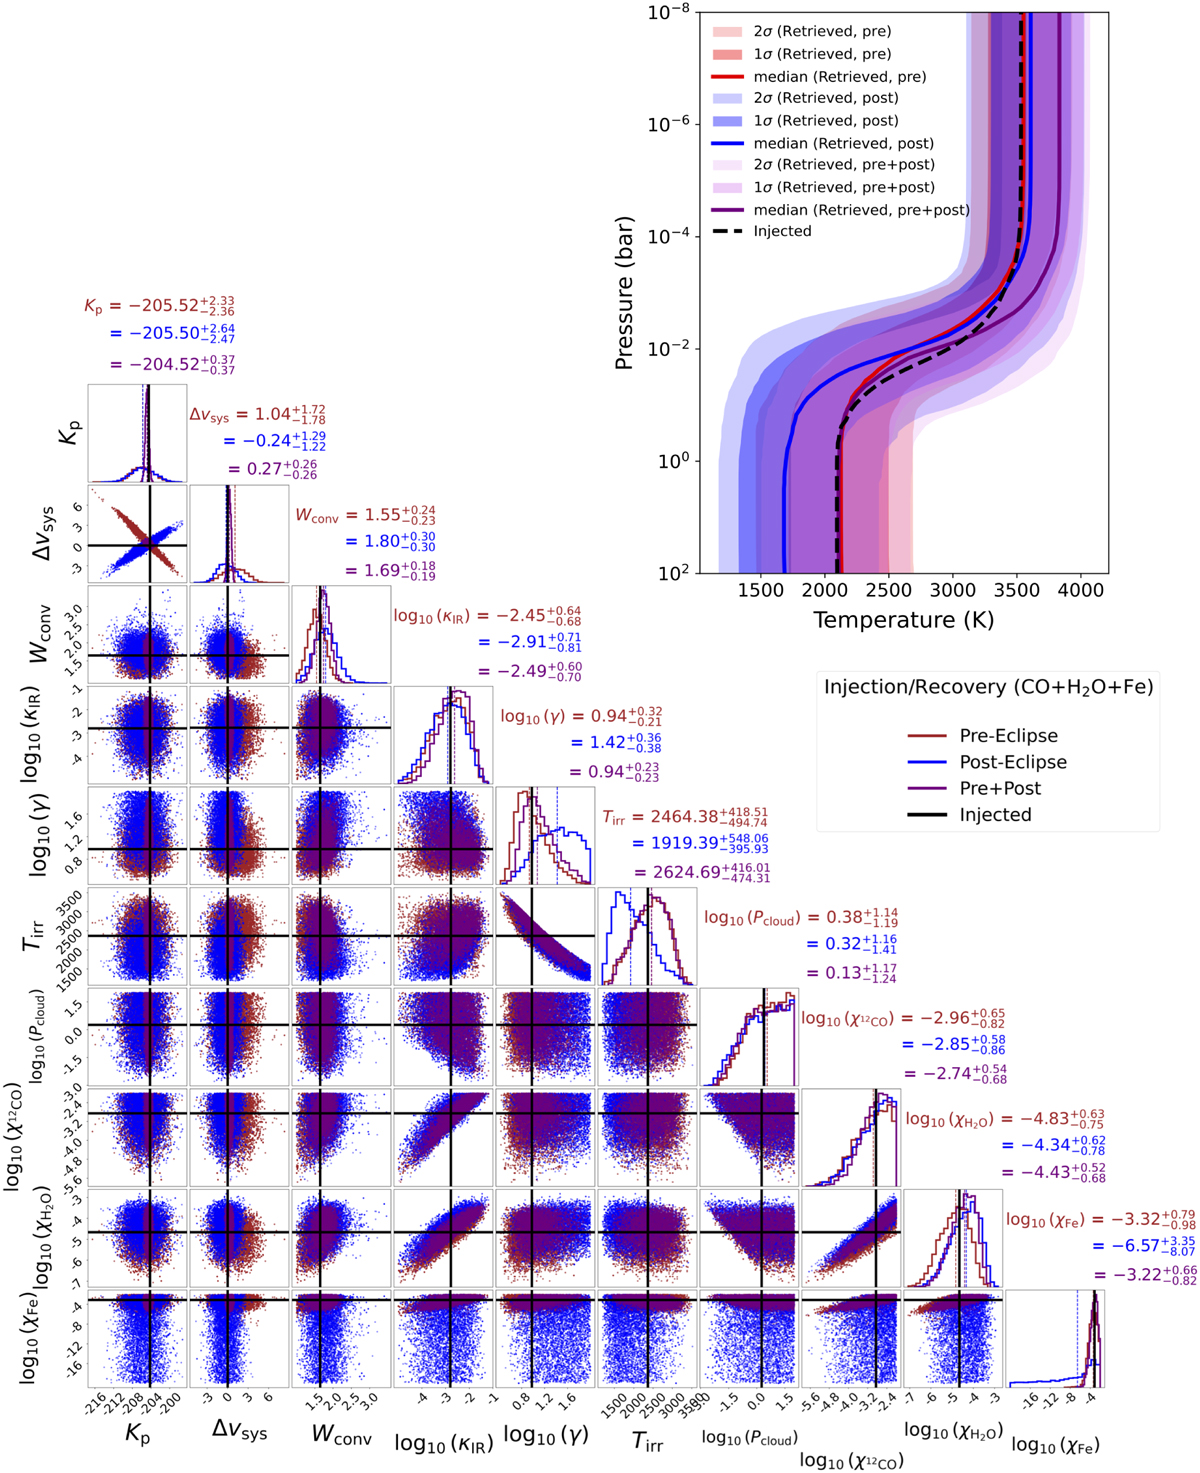
Fig. A.1
Download original image
Summary of our injection tests for pre-, post- and pre+post-eclipse datasets outlined in Sect. 3.2, with the 1D and 2D marginalised posterior distributions of each of our model parameters displayed. The red, blue and black posterior distributions represent the datasets, with the injected values highlighted by horizontal and vertical solid purple lines. The dotted lines show the retrieved median values. Upper right: the retrieved T–P profiles are computed from 10,000 random samples of the MCMC; the solid curves show the median profiles and the shaded regions show the 1σ and 2σ contours. The dashed black curve shows the injected T–P profile.
Current usage metrics show cumulative count of Article Views (full-text article views including HTML views, PDF and ePub downloads, according to the available data) and Abstracts Views on Vision4Press platform.
Data correspond to usage on the plateform after 2015. The current usage metrics is available 48-96 hours after online publication and is updated daily on week days.
Initial download of the metrics may take a while.